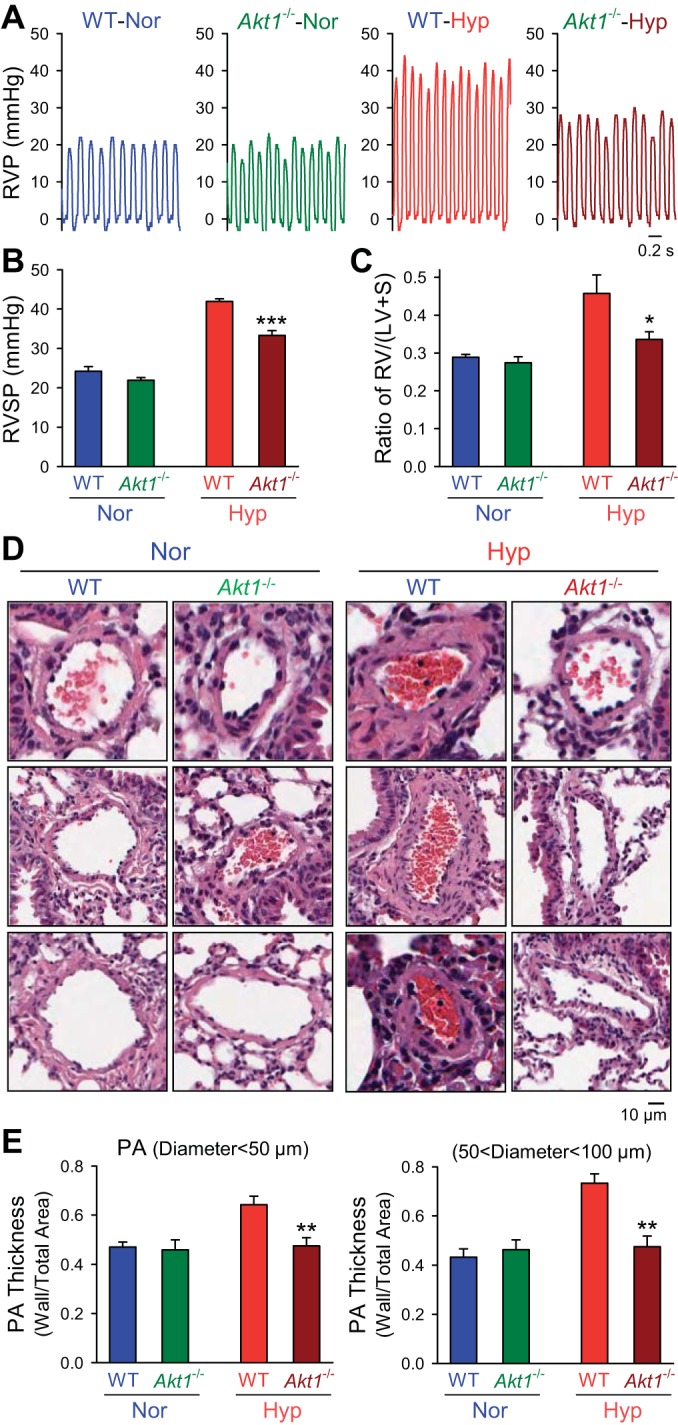
Fig. 3.

Deletion of Akt1 attenuates hypoxia-induced pulmonary hypertension and pulmonary vascular remodeling. A and B: representative record of RVP (A) and summarized data (means ± SE, B) of peak RVSP (B) in normoxic (n = 6) and hypoxic (n = 6) Akt1−/− mice. ***P < 0.001 vs. WT-Hyp. C: averaged Fulton index (means ± SE) in normoxia and hypoxic WT mice or Akt1−/− mice. *P < 0.05 vs. WT-Hyp. D and E: hematoxylin and eosin (H and E) images (D) of small PAs and summarized data (means ± SE, E) of the medial thickness of PAs with a diameter <50 μm (left) or between 50 and 100 μm (right) from WT mice or Akt1−/− mice under normoxic or hypoxic exposure. All significance markers are vs. hypoxic WT control animals. **P < 0.01 vs. WT-Hyp.
