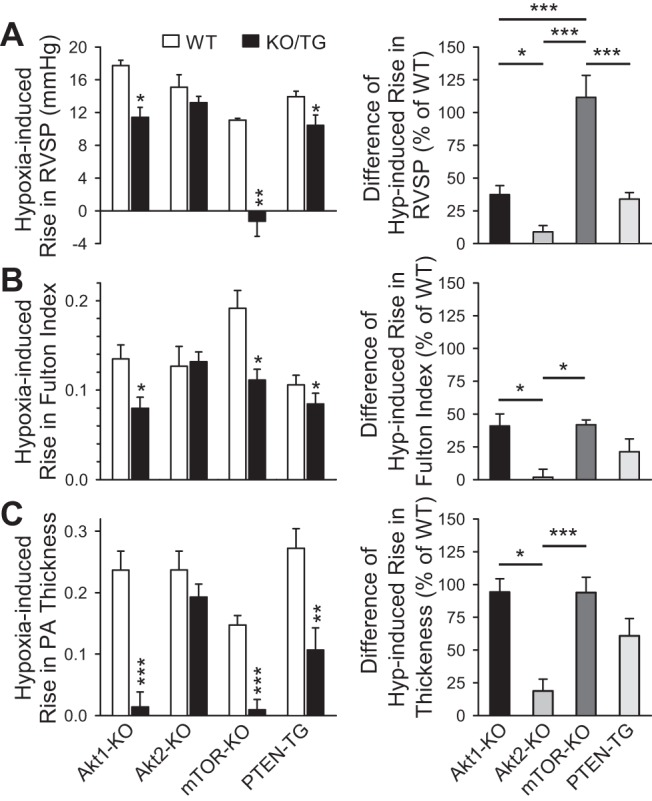
Fig. 7.

Smooth muscle cell-specific KO of mTOR has the greatest inhibitory effect on hypoxia-induced pulmonary hypertension. A–C: summarized data (means ± SE, left) demonstrating the chronic hypoxia-induced increases in RVSP (A), Fulton index [RV/(LV+S)] (B), and PA wall thickness (C) in WT, Akt1-KO mice (Akt1−/−), Akt2-KO mice (Akt2−/−), smooth muscle-specific conditional and inducible mTOR-KO mice, and PTEN-TG mice. *P < 0.05, **P < 0.01, ***P < 0.001 vs. WT. Right: summarized data (means ± SE) showing the differences of chronic hypoxia-mediated increases in RVSP (A), Fulton index (B) and PA wall thickness (C) between WT mice and Akt1-KO, Akt2-KO, mTOR-KO, or PTEN-TG mice. The difference (% of WT) was calculated by the ratio of the hypoxia-induced increases in KO/TG mice to the hypoxia-induced increases in WT mice. *P < 0.05, **P < 0.01, ***P < 0.001 between different strains indicated by horizontal bars.
