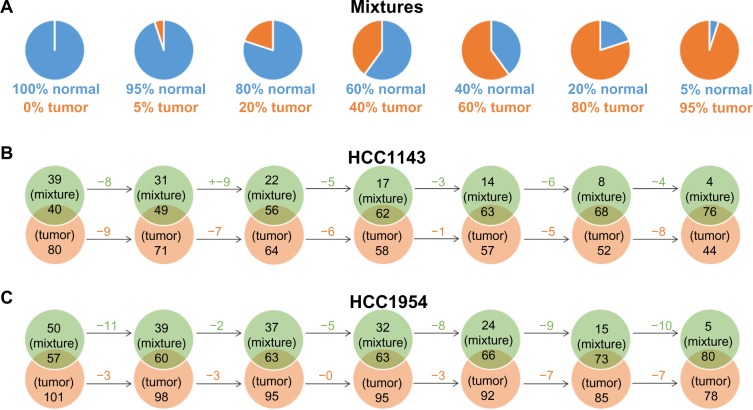
Figure 5.
The comparisons of tumor/normal mixtures and tumor cell lines (HCC1143_T and HCC1954_T). (A) The 100% normal is a subset of reads in normal cell line (HCC1143_BL or HCC1954_BL) with the coverage 30×. Tumor/normal mixtures consist of different combinations of reads from normal 30× and tumor cell line (HCC1143_T or HCC1954_T). (B) and (C) The comparisons of ALUs insertions on mixtures and tumor cell lines. The larger intersection ALUs between mixtures and HCC1143_T or HCC1954_T are obtained as more tumor reads are added in mixtures.

