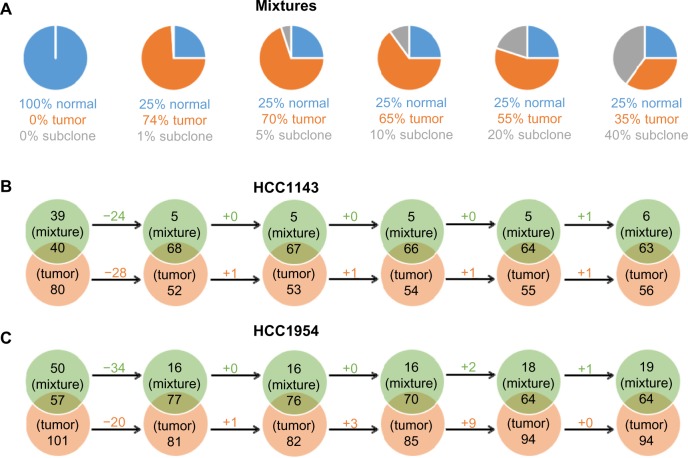
Figure 7.
The comparisons of tumor/normal/subclone mixtures and tumor cell lines (HCC1143_T and HCC1954_T). (A) In all, ∼500 novel SNVs and ∼200 novel SVs are spiked into each subclone, combining with normal and tumor reads to create a subclone spike-in mixture. (B) and (C) The comparisons of ALUs insertions on mixtures and tumor cell lines. As fewer tumor reads are in mixtures, the intersection ALUs between mixtures and tumor cell lines decrease while the unique ALUs of tumor samples increase slightly.

