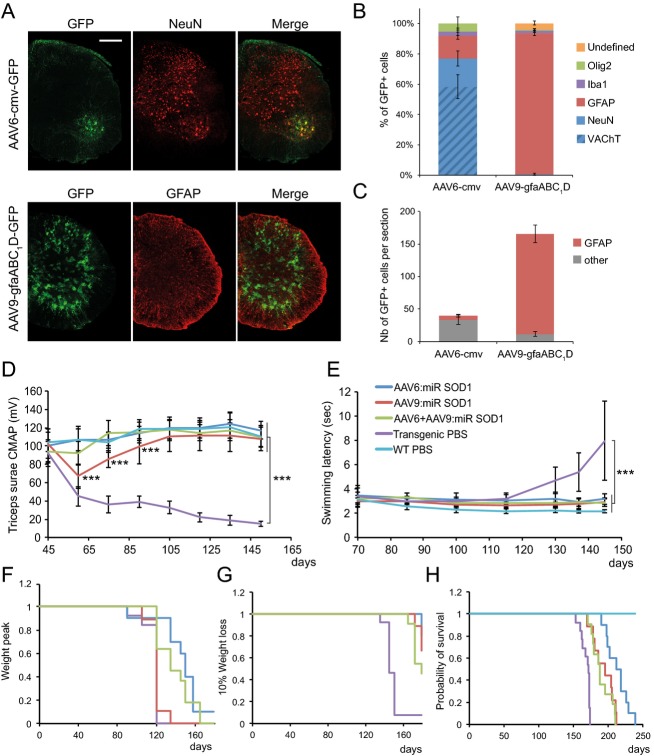
Figure 2.
AAV-mediated silencing of human SOD1 in motoneurons and/or astrocytes rescues neuromuscular function and increases lifespan of G93ASOD1 mice. (A) Following ICV injection of newborn mice, AAV6 coupled with the cmv promoter preferentially leads to GFP expression in NeuN-positive motoneurons, whereas AAV9-gfaABC1D specifically targets astrocytes. Represented are hemisections of lumbar spinal cords immunolabeled for GFP and either NeuN or GFAP. Scale bar: 250 μm. (B) Quantification of the percentage of GFP-positive cells colabeling with either NeuN, VAChT, GFAP, Iba1 or Olig-2 following ICV injection of AAV6-cmv:GFP or AAV9-gfaABC1D:GFP. Animals per group: n = 4. (C) Representation of the absolute number of GFP-positive astrocytes found per spinal cord section following ICV injection of AAV6-cmv:GFP or AAV9-gfaABC1D:GFP. (D) Compound muscular action potential (CMAP) values representing neuromuscular function were recorded from triceps surae of treated and control animals. Neuromuscular function appears to be maintained in AAV-injected animals compared to transgenic controls. AAV6:miR SOD1: n = 10, AAV9:miR SOD1: n = 9, AAV6 + AAV9:miR SOD1: n = 11, transgenic PBS: n = 13, WT PBS: n = 15. Note that CMAP values are significantly decreased at days 60, 75, and 90 in the AAV9:miR SOD1 group with respect to WT PBS (P < 0.001). (E) Swimming performance over disease course reveals improved motor abilities in treated animals. AAV6:miR SOD1: n = 8, AAV9:miR SOD1: n = 9, AAV6 + AAV9:miR SOD1: n = 10, transgenic PBS: n = 13, WT PBS: n = 15. (F) Kaplan–Meier representing disease onset, as defined by the day when mice reach their peak body weight. AAV6:miR SOD1 significantly delays median disease onset by 30 days when compared to PBS-injected G93ASOD1 mice (transgenic PBS: 120 ± 5.6, AAV6:miR SOD1: 150 ± 21.5, AAV9:miR SOD1: 120 ± 7.5, AAV6 + AAV9:miR SOD1: 135 ± 17.6). (G) Kaplan–Meier representing entry into end disease stage, as defined by the time when mice show 10% weight loss from their peak body weight. AAV9:miR SOD1 significantly prolongs early disease phase by 34 days when compared to control animals. (H) Kaplan–Meier survival curve of AAV-injected and control animals. AAV6:miR SOD1: n = 10, AAV9:miR SOD1: n = 9, AAV6 + AAV9:miR SOD1: n = 11, transgenic PBS: n = 13, WT PBS: n = 15. Values are expressed as mean ± standard deviation. One-way ANOVA and Newman–Keuls post hoc test. Two-way ANOVA and Newman–Keuls post hoc test was used for evaluation of the significance of group effect on CMAP values and swimming performance. ***P < 0.001. SOD1, superoxide dismutase 1; ICV, intracerebroventricular; WT, wild-type.

