Figure 5.
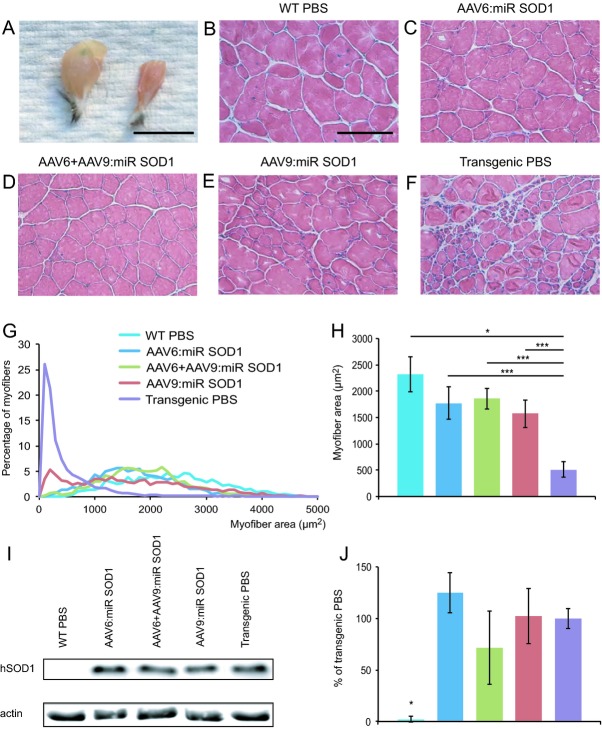
Muscle fiber diameter is significantly greater in vector-injected mice compared to control transgenic animals. (A) Macroscopic view of gastrocnemius muscles from an AAV6:miR SOD1- versus a PBS-injected G93ASOD1 mouse. Scale bar: 1 cm. (B–F) Muscle sections from treated and control animals reveal conserved muscle integrity in vector-injected animals. Scale bar: 100 μm. (G) Distribution of myofiber section area in the gastrocnemius muscle demonstrates protection from muscle atrophy. Small diameter fibers are only observed in transgenic control animals and, to a lesser extent, in AAV9:miR SOD1-injected animals. (H) Average muscle fiber area for vector- and PBS-injected groups. Area was measured for all individual fibers, in five 600 × 400 μm fields of view per animal; n = 5 animals per group. (I) Western blot representing human SOD1 levels in the quadriceps of mice injected ICV with AAV vectors compared to PBS-injected controls. (J) Quantification of human SOD1 levels expressed as percentage of human SOD1 amount detected in PBS-injected transgenic mice. Values are represented as mean ± standard deviation. *P < 0.05, ***P < 0.001, one-way ANOVA and Newman–Keuls post hoc test. SOD1, superoxide dismutase 1.

