
Figure 1.
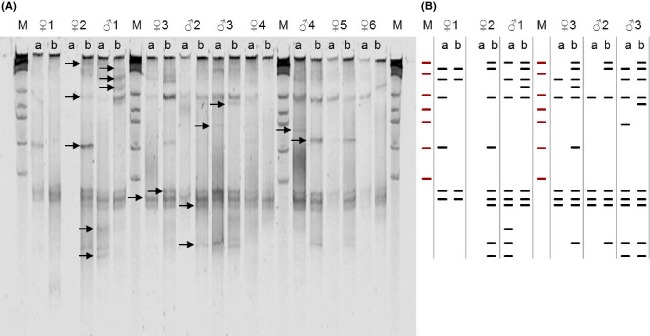
Temperature gradient gel electrophoresis (TGGE) image of bacterial assemblages in faecal samples from ten blue tits, showing variation in paired samples from six female (♀1–6) and four male blue tits (♂1–4), from the 2007 and 2008 breeding seasons (A and B respectively). Arrows indicate the relative positions of the bands detected. M denotes lanes containing the marker λHindIIIEcoR1. A schematic of banding patterns is shown to the right of the gel image.