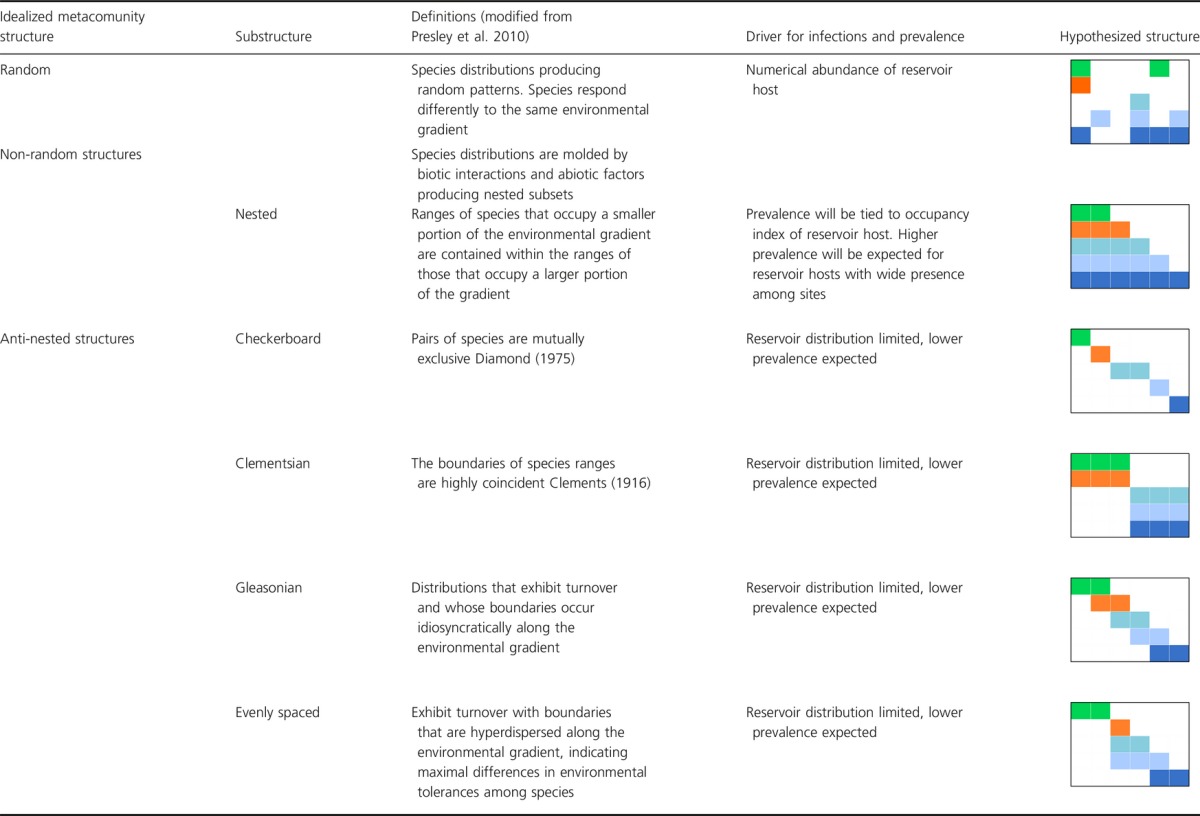
Table 2.
Definitions of metacommunity structures, substructures, and proposed mechanisms for infection and prevalence at each level, for each one of these structures and substructures. Colors represent different species, dark blue represents reservoirs