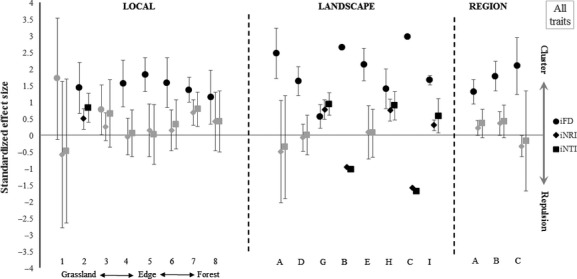
Figure 5.

Individual-based morphologic approach showing the structure of nonvolant small mammal assemblages at three scales. Bars are equivalent to confidence intervals of 95%. Black symbols indicate index values different from the random expectation. iFD = Individuals Functional Diversity; iNRI = individual net relatedness index; iNTI = individual nearest taxon index.
