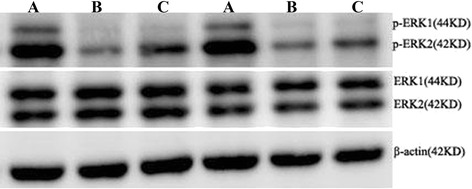
Figure 4.

The expressions of p-ERK1/2 and ERK1/2 in hippocampus. A: Control group, B: Modeled group, C: Treated group. There was no significant difference in the expression of total ERK1/2 in hippocampus among control, model and treated group rats, while the expression of p-ERK1/2 in model and treated groups decreased significantly compared with control group. And in compare with model group, the expression of p-ERK1/2 in treated group increased significantly.
