Figure 5.

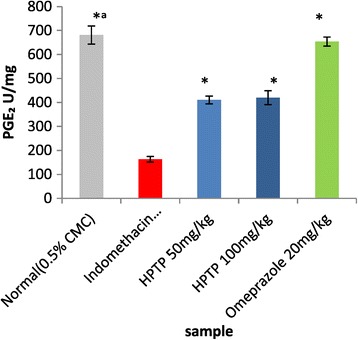
Effect of HPTP on Prostaglandin E 2 activity. Values are expressed as Mean ± S.E.M. (*a) indicates significance at P < 0.05 versus indomethacin with HPTP chalcone and (*) at P < 0.05 versus indomethacin with normal control.

Effect of HPTP on Prostaglandin E 2 activity. Values are expressed as Mean ± S.E.M. (*a) indicates significance at P < 0.05 versus indomethacin with HPTP chalcone and (*) at P < 0.05 versus indomethacin with normal control.