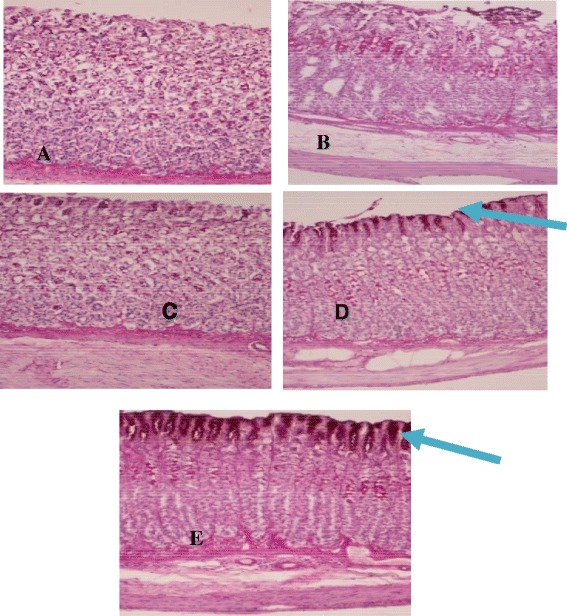
Figure 8.

Histological evaluation of gastric glycoproteins in sections stained with PAS. The magenta color in the apical epithelial cells shows glycoprotein accumulation in the gastric glands (blue arrow). Normal control group (A), indomethacin treated group (B), HPTP pre-treated groups (C & D) and omeprazole pre-treated group (E) (PAS stain, magnification 20x).
