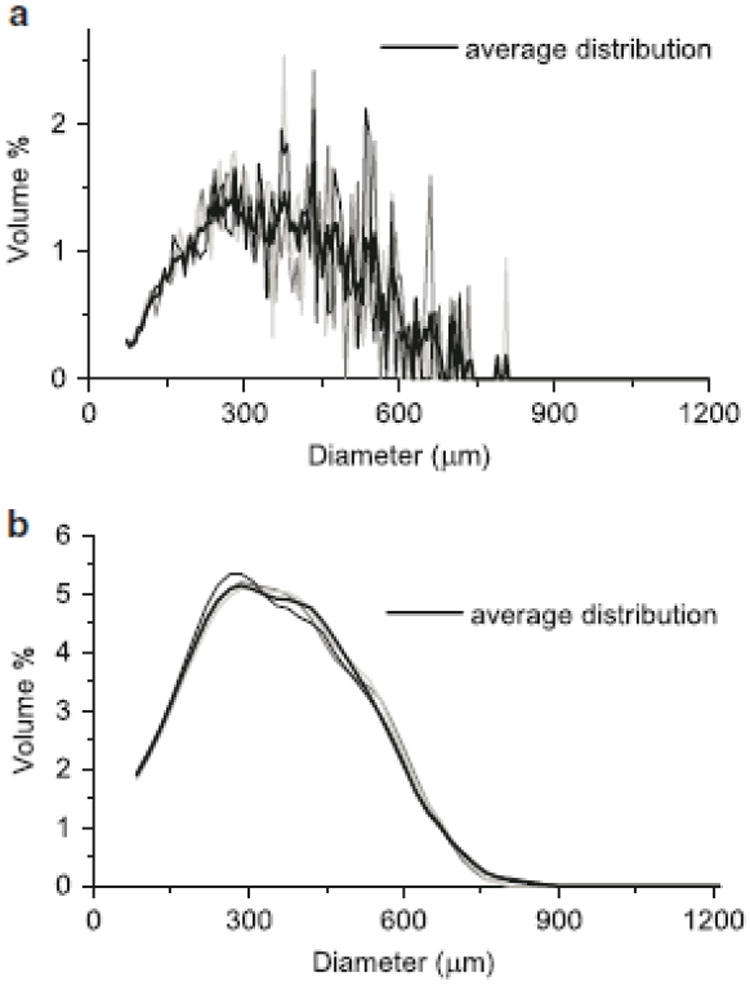
Fig. 2.

Aggregate size distributions obtained using a Coulter counter. a Resolution of 200 size bins from 70 μm to 1200 μm, comparing average of five samples to three representative individual samples. b Resolution of 50 size bins from 70 to 1200 μm, smoothed using a weighted moving average, comparing average of five samples to three representative averages of two samples
