
Fig. 3.
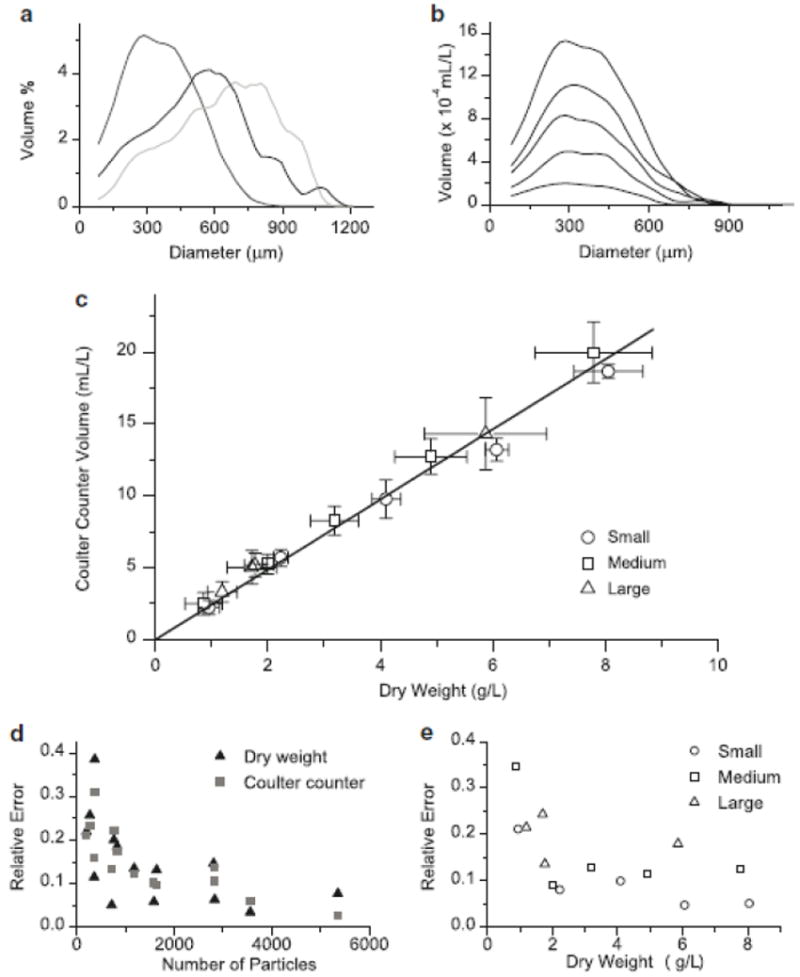
a Average aggregate size distributions from mid-exponential phase cultures of Taxus cuspidata. b Effect of biomass concentration on distribution curves from a dilution series of culture with a mean aggregate size of 365 μm. c Correlation between dry weight and total volume measured on Coulter counter for cultures with different aggregate size distributions (from Fig. 3a); Small = mean 365 μm, Medium = mean 537μm, Large = mean 625 μm, error bars represent standard deviation of 5 measurements. d Comparison of relative error (standard deviation divided by mean) for total biomass measurements comparing dry weight and Coulter counter biomass, based on total particle number as determined by the Coulter counter. e Comparison of relative error in total biomass measurements (average of Coulter counter and dry weight error) for cultures with different aggregate size profiles (Fig. 3a and Fig. 3b)