
Fig. 4.
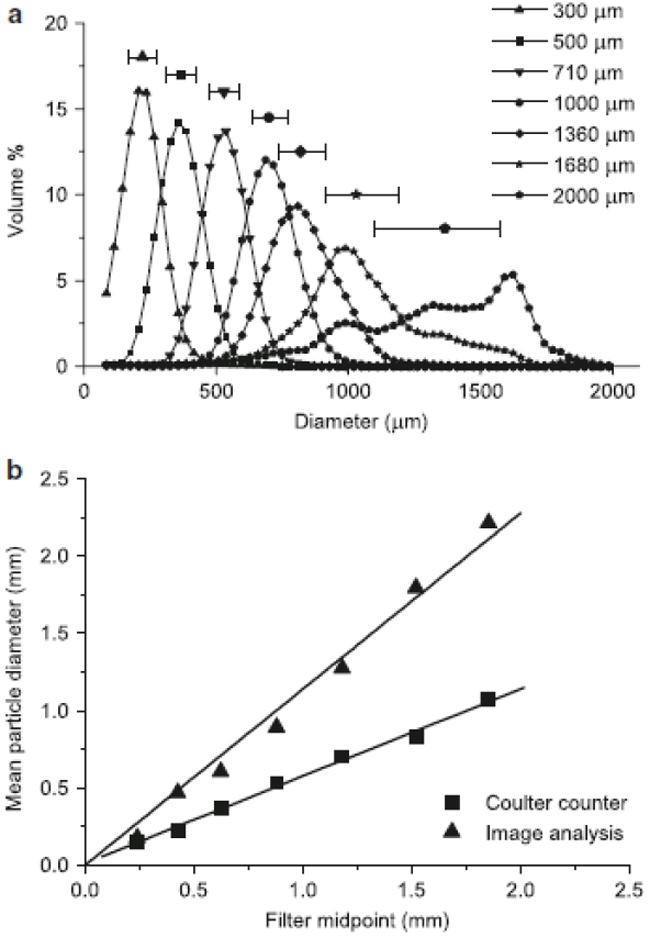
a Size distributions of aggregates separated on a series of filters and analyzed on the Coulter counter; each data point above the corresponding distribution represents the median and error bars represent median 50% of data, labels refer to filter size on which the sample was collected. b Correlation between mean size of filtered fractions determined using both the Coulter counter and image analysis against the volume weighted average of filter sizes between which aggregates were separated