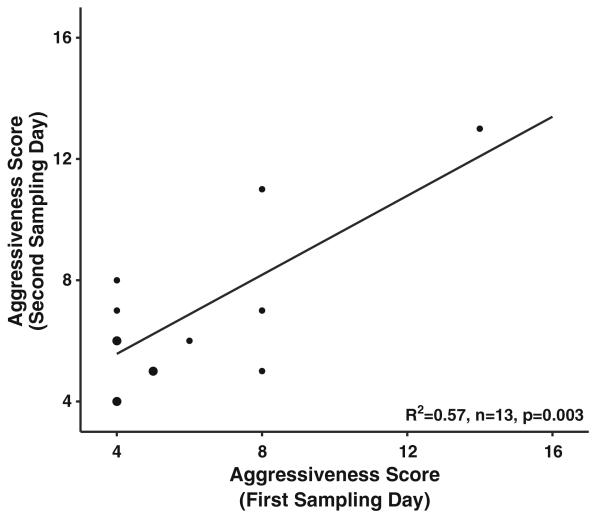
Fig. 2.
Distribution of parental colony phenotypes. Correlation of colony aggressiveness scores across our sample population of 13 colonies. Line presents the fitted values derived from the regression model and used in correlative tests. Circle size is proportional to number of colonies that scored within the same range. The majority of colonies scored similarly from day 1 to day 2 of ratings test

