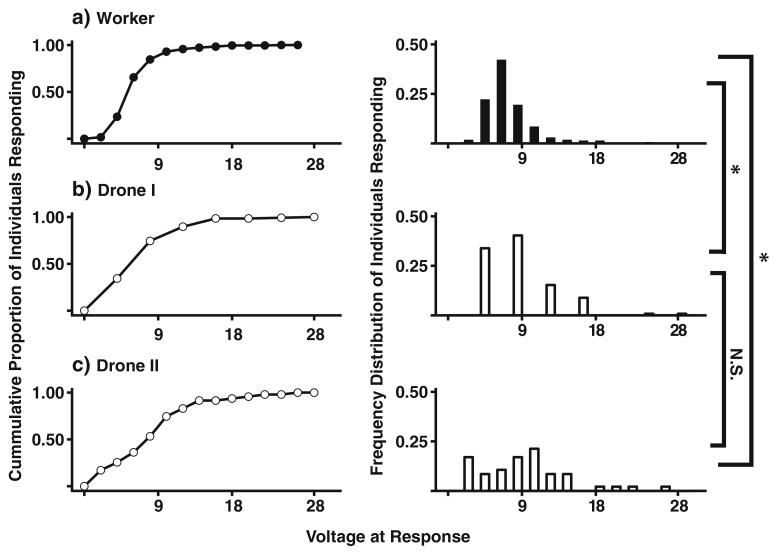
Fig. 3.
Cumulative response to shock of two honey bee castes. Curves show the cumulative group response of female foraging worker sting (a) and male drone abdomen flexion (b, c) to a noxious stimulus (shock). Histograms present the frequency distribution of the response to voltage in each of the groups a, b, and c. Histogram for Worker response (a) is significantly different from both Drone I (b) and Drone II (c). Drone I group (b) represents the haploid nephews of the Worker group (a). Drone II group (c) is an additional group of males that were assessed later using the same presentation protocol as Workers (a) (see “Materials and methods” for description)

