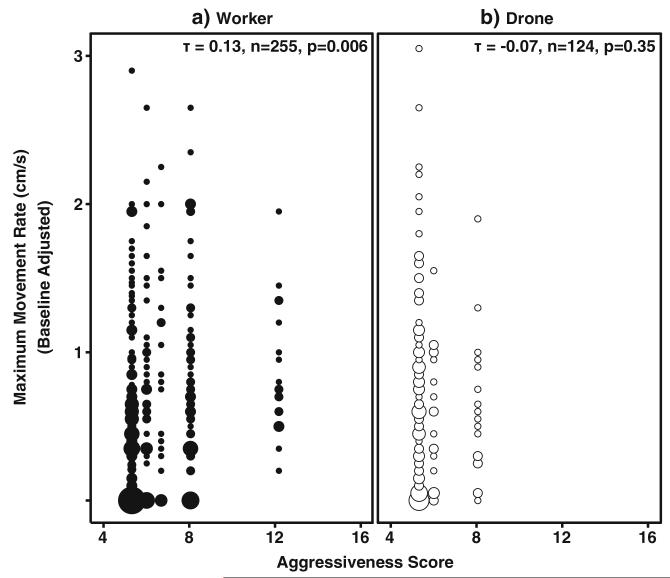
Fig. 5.
Relationship between colony phenotype and individual movement rates. Non-parametric correlation of individuals’ baseline-adjusted maximum movement rate and colony phenotype for Foragers (a) and Drones (b). Circle size corresponds to number of individual responses. Movement rates and colony phenotype correlated positively in the Workers (Kendall’s Tau, n=255, t=0.13, p=0.006). No significant correlation was observed between the movement rate of drones and parental colony phenotype

