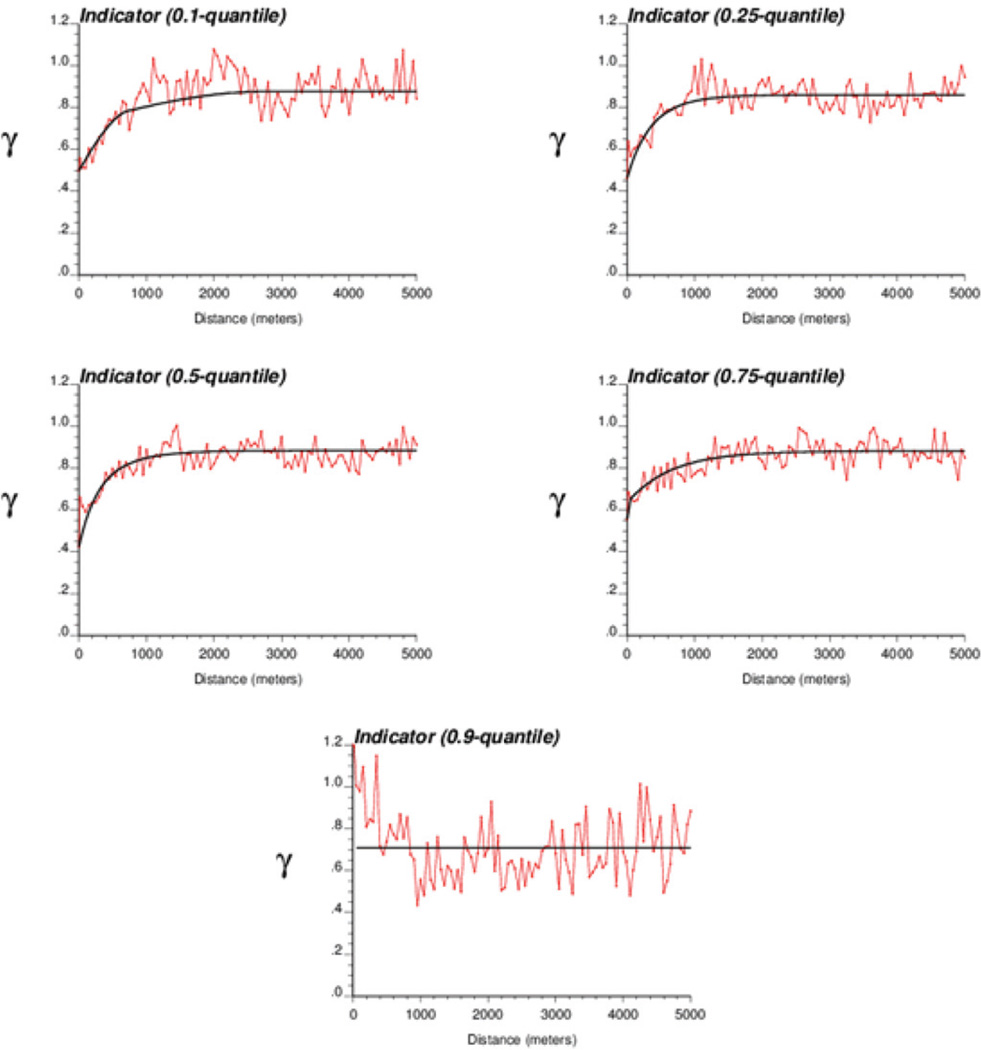
Figure 5.
Experimental indicator semivariograms computed from arsenic well data using five threshold values. The solid line is the model fitted using least-squares regression. Note how the short-range variability increases for the upper quartile and ninth decile of the sample histogram, which reflects the smaller spatial connectivity of high arsenic concentrations

