Figure 6.
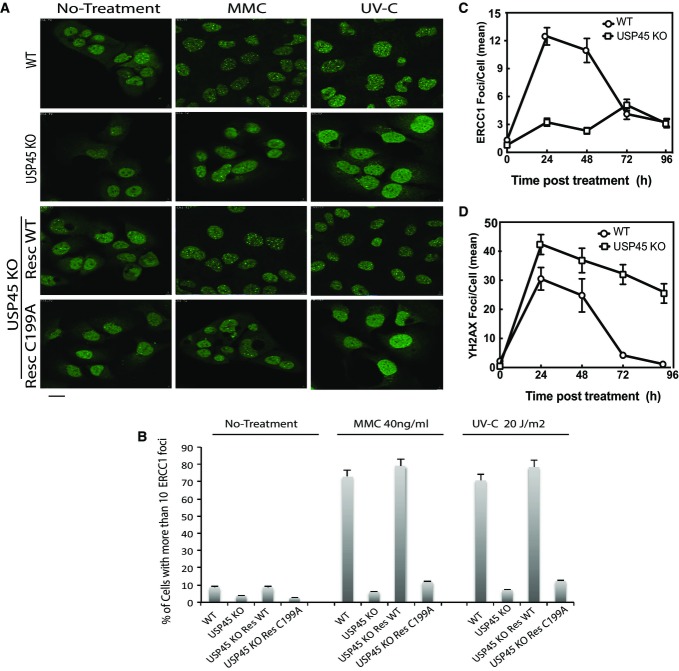
- Wild-type (WT), USP45 knockout (KO) or USP45 KO cells re-expressing wild-type USP45 (RESWT) or catalytically inactive USP45 [Cys199Ala] (RESCA) were used to analyse ERCC1 foci formation. Staining and analysis of endogenous ERCC1 foci formation was undertaken before (left panel), or after DNA damage induction by mitomycin C (40 ng/ml, 16 h, middle panel) or UV (20 J/m2 followed by 3-h recovery, right panel). Three independent experiments were performed in which 500 cells per experiment were analysed. Scale bar, 10 μm.
- Proportion of cells displaying more than 10 endogenous ERCC1 foci were quantified. Three independent experiments were performed in which 500 cells per experiment were analysed. Results are the mean of 3 experiments ± SD.
- The wild-type and USP45 knockout U2OS cells were treated with mitomycin C (40 ng/ml, 16 h) and total number of ERCC1 staining foci per cell was quantified in at least 50 independent cells at the indicated times. Similar results were obtained in two separate experiments. The data are presented as the average number of ERCC1 staining foci per cell.
- As in (C), except that γ-H2AX-staining foci were analysed. The data are presented as the average number of γ-H2AX staining foci per cell.

