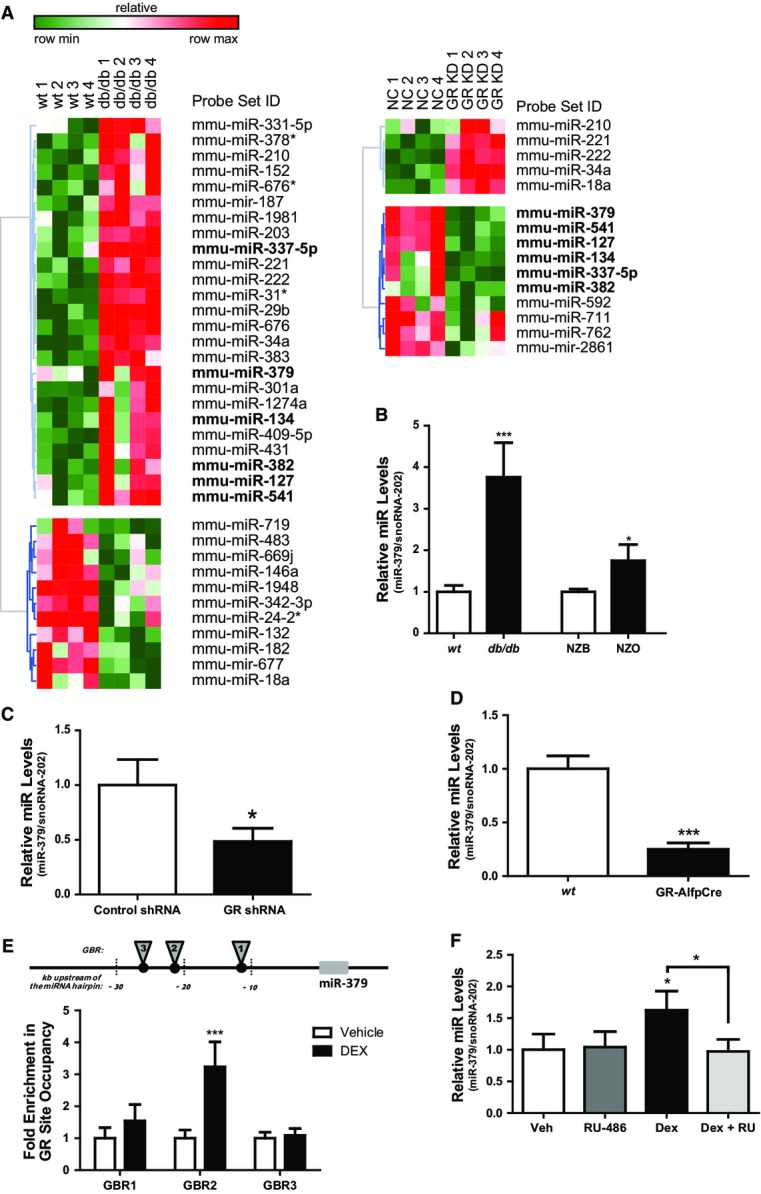
Heatmap showing relative miRNA expression between wild-type (wt) and db/db mice (n = 4), and between mice treated with negative control (NC) and GR-specific miRNA recombinant adeno-associated virus (rAAV) (n = 4). Higher and lower expression is displayed in red and green, respectively. Commonly regulated miRNAs in the miR-379/410 cluster are shown in bold. Differentially regulated miRNAs are ≥ twofold, P < 0.05.
Quantitative miR-379 PCR levels in livers of db/db, New Zealand obese (NZO) mice, and corresponding controls—wt and New Zealand black (NZB) (n ≥ 4). Bar graphs show mean ± SEM; t-test: ***P < 0.001 or *P < 0.05.
Quantitative miR-379 levels in livers of db/db mice treated with control or GR-specific shRNA adenovirus (n = 5). Bar graphs show mean ± SEM; t-test: *P < 0.05.
Hepatic miR-379 levels as determined by RT–qPCR analysis in wt and hepatocyte-specific GR knockout mice (GR-AlfpCre) (n = 4). Bar graphs show mean ± SEM; t-test: ***P < 0.001.
Chromatin immunoprecipitation (ChIP) qPCR for validation of GR-binding regions (GBR) upstream miR-379 hairpin: 1 (−11,197 to −111,268), 2 (−21,021 to −21,135), and 3 (−26,761 to −26,793). Fold enrichment of GR-binding site occupancy relative to negative control, anti-HA. (n = 4). Bar graphs show mean ± SEM; t-test: ***P < 0.001.
miR-379 levels in human liver treated ex vivo with or without 1 μM RU486 and 0.1 μM DEX (n = 4). snoRNA-202 was used for normalization of miRNA levels. Bar graphs show mean ± SEM; ANOVA (with post hoc test): *P < 0.05.

