
Figure 2.
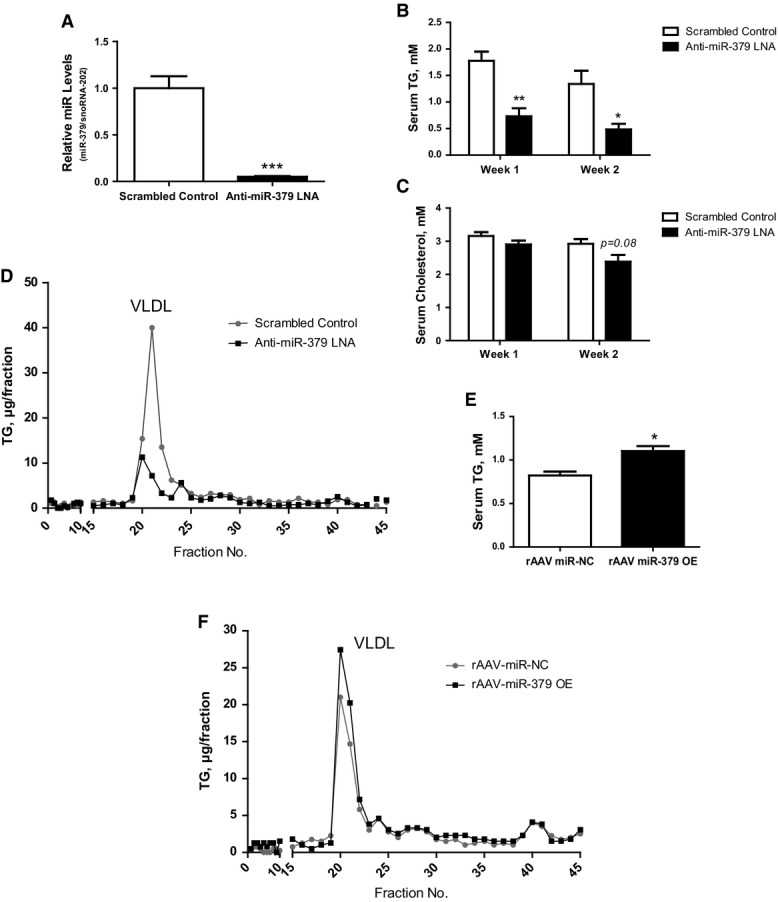
miR-379 controls systemic VLDL triglyceride levels
- RT–qPCR analysis of miR-379 expression in C57Bl/6J (wt) mice treated with anti-miR-379 or scrambled control locked nucleic acid (LNA) (n = 5). Bar graphs show mean ± SEM; t-test: ***P < 0.001.
- Serum triglyceride (B) and cholesterol (C) levels after 1 and 2 weeks of LNA treatment of same animals as in (A) under fed conditions. Bar graphs show mean ± SEM; ANOVA (with post hoc test): **P < 0.01 or *P < 0.05.
- Triglyceride profiles of fast-protein liquid chromatography (FPLC)-fractionated serum of same animals as in (A). Very-low-density lipoprotein (VLDL) peak is indicated.
- Serum triglyceride levels of wt mice overexpressing miR-379 or scrambled control miRNA via hepatocyte-specific rAAV vectors (n = 4). Bar graphs show mean ± SEM; t-test: *P < 0.05.
- Triglyceride profiles of FPLC-fractionated serum of same animals as in (E). VLDL peak is indicated.