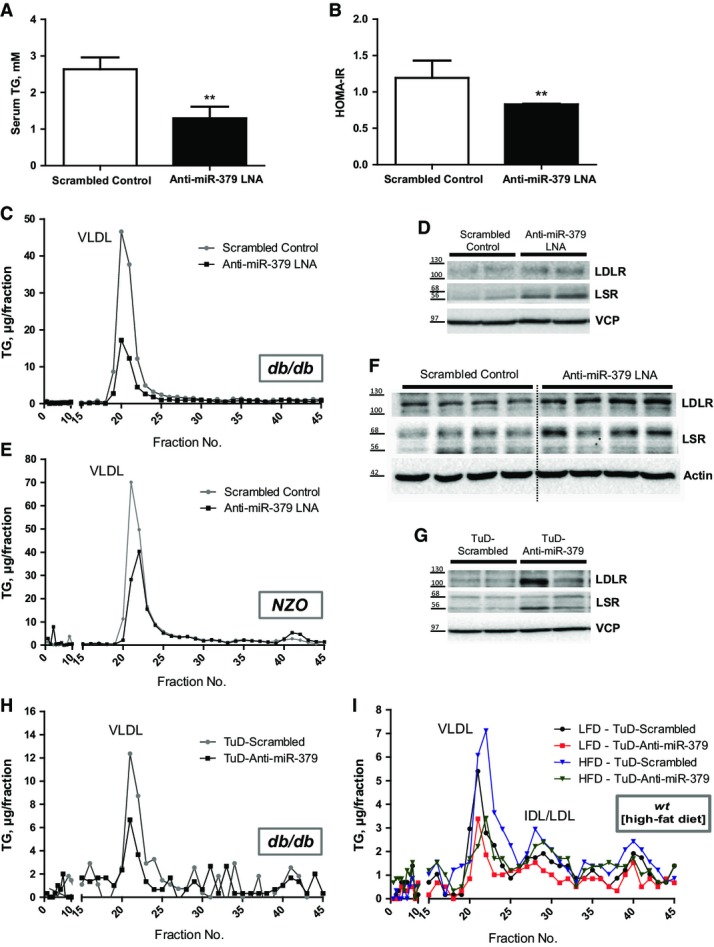
Serum triglyceride levels in db/db mice treated with anti-miR-379 or scrambled control LNA (n = 7). Bar graphs show mean ± SEM; t-test: **P < 0.01.
Homeostatic model assessment for insulin resistance (HOMA-IR) of same animals as in (A). Bar graphs show mean ± SEM; t-test: **P < 0.01.
Triglyceride profiles of FPLC-fractionated serum of same animals as in (A) under fed conditions. VLDL peak is indicated.
Protein levels of LSR and LDLR from livers of same animals as in (A). Shown are the LSR-α (68 kDa) and LSR-β (56 kDa) subunits and the glycosylated LDLR (between 100 and 130 kDa) protein.
Triglyceride profiles of FPLC-fractionated serum of NZO mice treated with anti-miR-379 or scrambled control LNA (n = 7). VLDL peak is indicated.
Protein levels of LSR and LDLR from livers of same animals as in (E).
Protein levels of LSR and LDLR from livers of db/db mice treated with an anti-miR-379 or scrambled control Tough Decoy (TuD) construct delivered by rAAV 28 days post-injection (n = 8).
Triglyceride profiles of FPLC-fractionated serum of same animals as in (G) under fed conditions. VLDL peak is indicated.
Triglyceride profiles of FPLC-fractionated serum of C57Bl/6J mice fed with low-fat (10%) or high-fat (60%) diet for 12 weeks and treated with either anti-miR-379 or scrambled control Tough Decoy (TuD) construct delivered by rAAV. Mice were sacrificed 4 weeks after virus injection at 18 weeks of age. VLDL peak is indicated.

