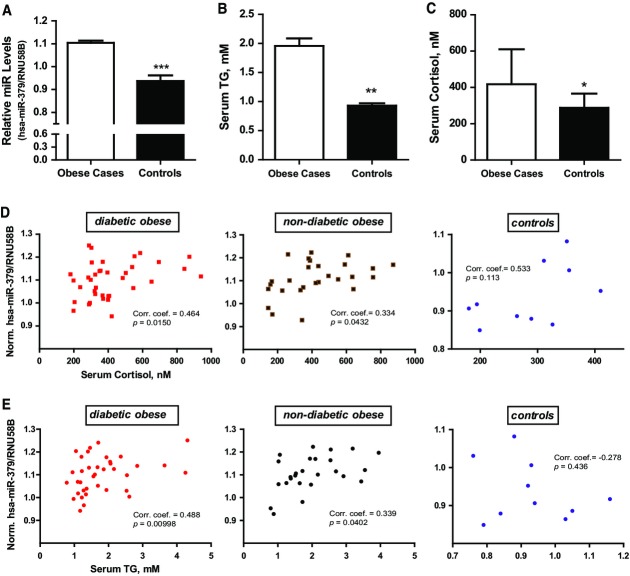
Figure 5.
- Hepatic miR-379 levels in obese patients (n = 64) and healthy controls (n = 10). Bar graphs show mean ± SEM; t-test: ***P < 0.001.
- Serum triglyceride (B) and cortisol (C) levels in obese and healthy control individuals. Bar graphs show mean ± SEM; t-test: **P < 0.01 or *P < 0.05.
- Correlation analyses of human hepatic miR-379 and serum cortisol (D) or triglycerides (E) (n = 74). Shown are the Spearman's rank coefficients and P-values. Sample population was stratified into diabetic obese, non-diabetic obese, and controls based on statistically significant interaction effects of the groups and serum parameters in a multiple linear regression model.

