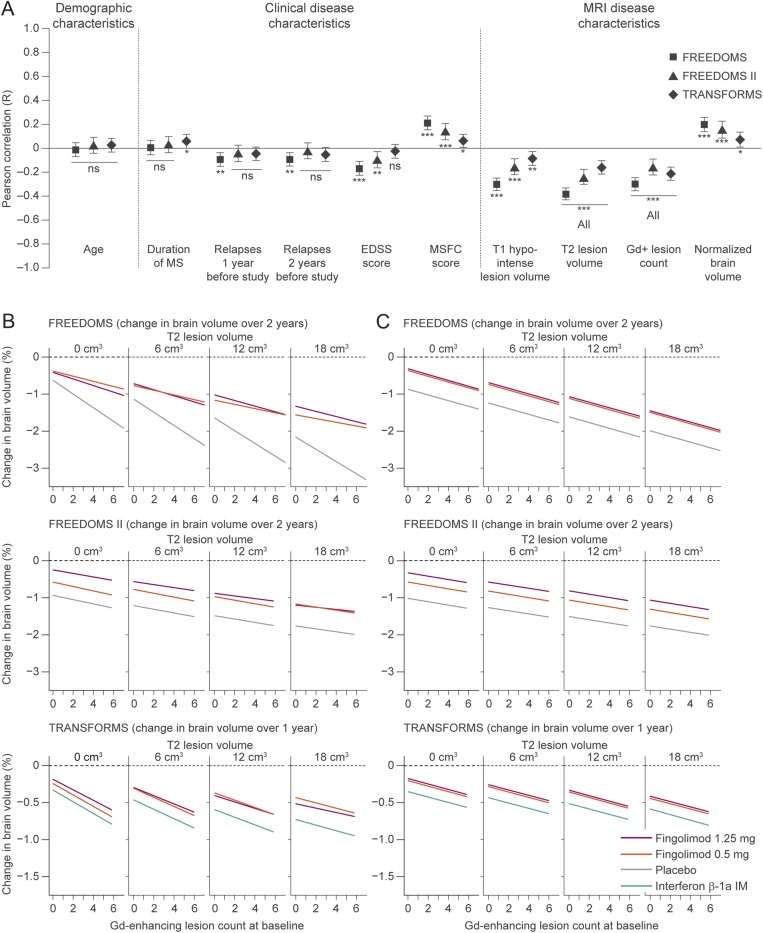
Figure 2. Baseline predictors of on-study PBVC and the effect of treatment.
(A) Pearson correlations between PBVC from baseline to end of study, and candidate baseline predictive variables are shown ± 95% confidence intervals; values are given in table e-2. The correlation between PBVC and MSFC score is positive, because MSFC score decreases as disability increases. ***p < 0.001; **p < 0.01; *p < 0.05. (B) Plots by treatment, of the fitted model of the association between PBVC from baseline to end of study, baseline T2 lesion volume, and baseline Gd-enhancing lesion count, including all possible 2-way parameter interactions. Estimates are from an analysis of covariance model with PBVC from baseline to end of study as the response variable, treatment as a factor, and Gd-enhancing lesion count and T2 lesion volume as continuous predictors. Ranges for T2 lesion volume and Gd-enhancing lesion count encompass the 90% range of values observed in FREEDOMS, FREEDOMS II, and TRANSFORMS. The statistical model was evaluated using the T2 lesion volumes shown at the top of each panel. (C) The fitted model as shown in panel B, but excluding parameter interactions (final model). EDSS = Expanded Disability Status Scale; Gd+ = gadolinium-enhancing; MS = multiple sclerosis; MSFC = Multiple Sclerosis Functional Composite; ns = not significant; PBVC = percentage brain volume change.

