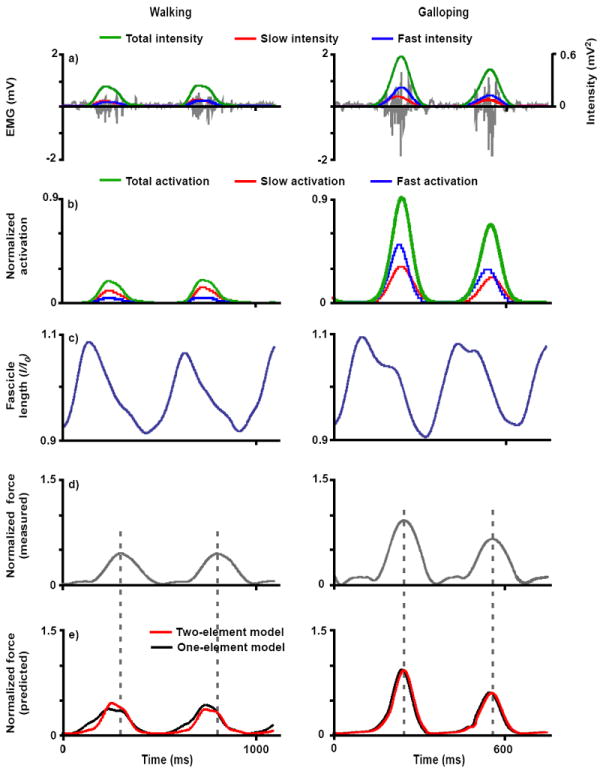
Figure 2.

Representative inputs and outputs of the one-element and two-element models for the goat LG muscle during walking and galloping: a) EMG (grey) and total (green), slow (red), and fast (blue) EMG intensity, b) total (green), slow (red), and fast (blue) activation normalized to maximum in vivo activation, c) fascicle length normalized to optimal resting length, d) measured tendon force normalized to maximum in vivo force, and e) muscle forces normalized to maximum in vivo force as predicted by the one-element model (black) and two-element model (red). These are representative trials from one goat. The dotted grey line indicates when the peak force occurs for each step.
