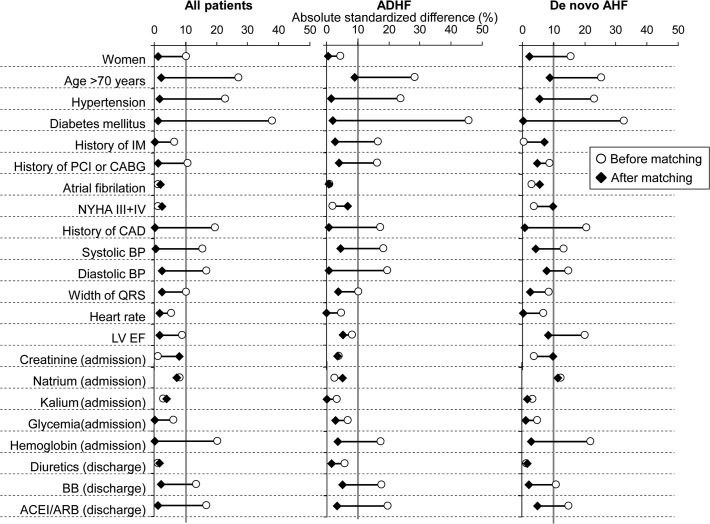
Fig 3. Absolute standardized differences (%) in observed covariates between patients with normal weight and those who were overweight/obese before and after matching of propensity score (age, diastolic blood pressure, heart rate, width of QRS interval, atrial fibrillation, hypertension, type-2 diabetes mellitus, coronary artery disease, creatinine level and haemoglobin level).
Covariates with a post-match absolute standardized difference <10% were considered successfully balanced.

