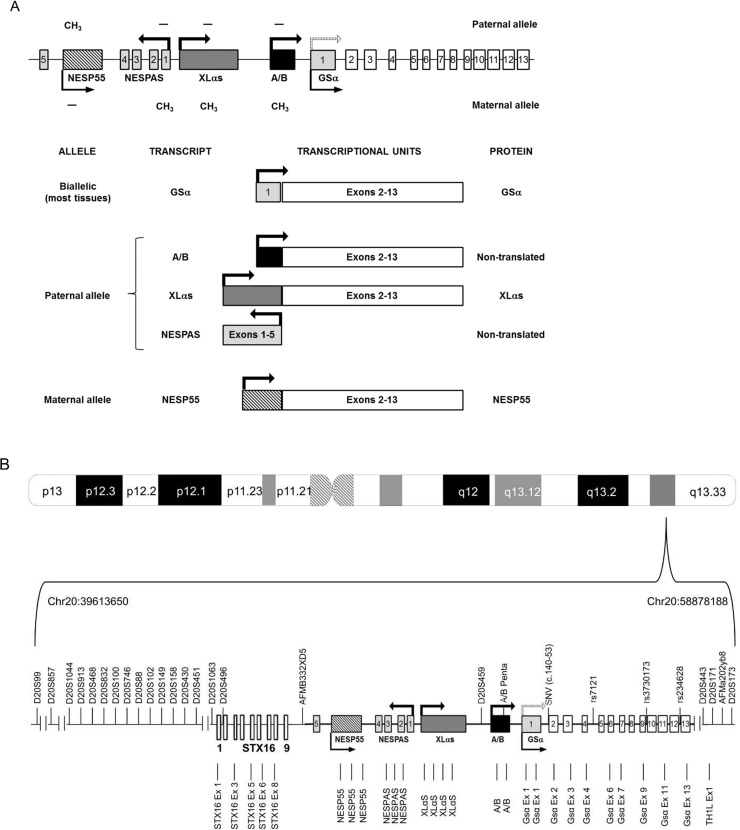
Fig 1. Graphic representation of the GNAS complex locus.
(A) Alternative exons and transcripts in the region. Each first alternative exon is depicted in a different format (the scratched rectangle corresponds to NESP55, the dark grey rectangle to XLαs, the black rectangle to exon A/B and the dotted rectangle to GSα exon 1). NESPAS exons 1–5 are shown as soft grey rectangles. White rectangles represent common exons 2–13 and the continuous line represents introns. Arrows indicate the origin and sense of the transcription (dotted arrow indicates that paternal GSα is not expressed in all tissues). Methylated regions are marked with a methyl group. (B) Probes and markers used for the analysis. Polymorphic markers are depicted above, MS-MLPA probes below. See text for details. Drawings not to scale.

