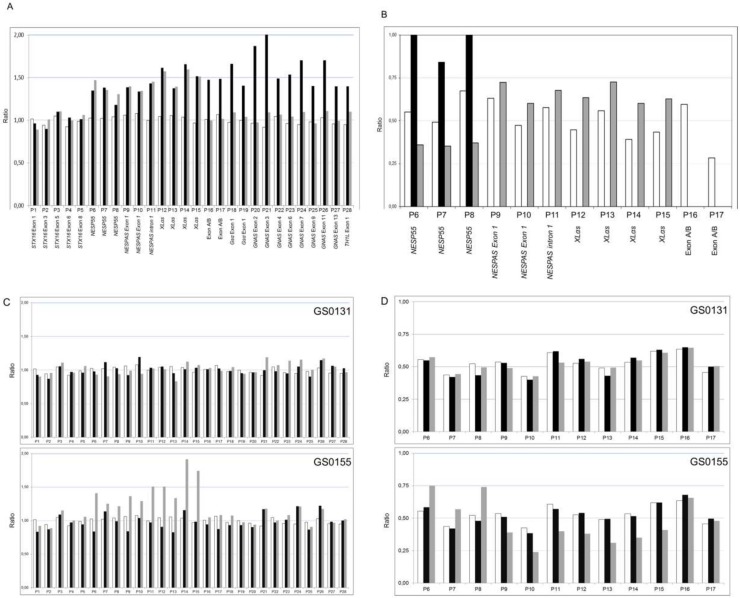
Fig 2. Dosage and methylation analysis of the GNAS locus.
In all cases, on the X-axis, MS-MLPA probes for copy number determination (P1 to P28) or methylation analysis (P6 to P17) are shown according to their chromosome location (detailed in Table 1). On the Y-axis, the final probe ratio is shown. (A) Dosage analysis of the GNAS locus in GS0131 (black bars) and GS0155 (grey bars) compared against the average of four controls (white bars). (B) Methylation analysis of the GNAS locus in GS0131 (black bars) and GS0155 (grey bars) compared against the average of four controls (white bars). GS0131 shows complete loss of methylation at NESPAS, XLαs and exon A/B, and gain of methylation at NESP55, whereas GS0155 shows complete loss of methylation at A/B, partial gain at XLαs and NESPAS and partial loss at NESP55. (C) Dosage analysis of the GNAS locus in GS0131 parents (upper panel) and GS0155 parents (lower panel) compared against the average of four controls. In all cases, black bars represent the father, grey bars represent the mother and white bars represent the controls. Mother of GS0155 presents the same duplication as her daughter, whereas absence of alterations in GS0131 parents demonstrates its ‘de novo’ origin. (D) Methylation analysis of the GNAS locus in GS0131 parents (upper panel) and GS0155 parents (lower panel) compared against the average of four controls. In all cases, black bars represent the father, grey bars represent the mother and white bars represent the controls. There is not any methylation alteration in the parents of GS0131. Mother of GS0155 presents a partial loss of methylation in XLαs (P12-P15) and NESPAS (P9-P11), and a partial gain of methylation in NESP55 (P6-P8), exon A/B not being affected. See text for details.

