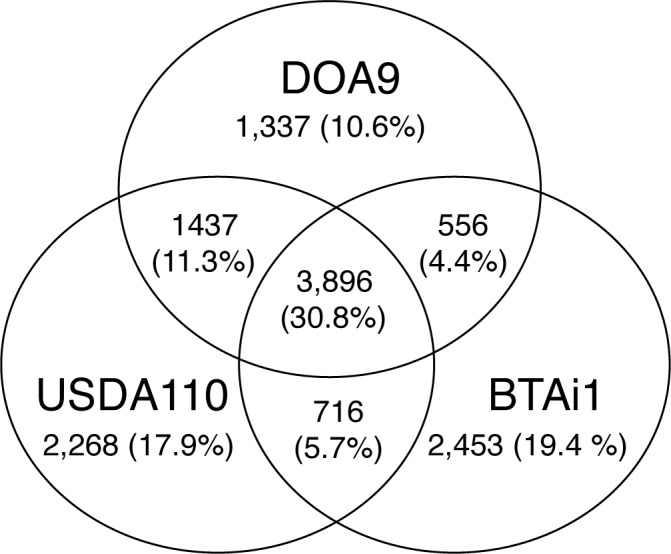
Fig 4. Comparative genomic analysis among Bradyrhizobium sp. DOA9, B. japonicum USDA110, and Bradyrhizobium sp. BTAi1.

Each genome is represented by a circle, and the numbers of shared and unique genes are shown by the overlapping and nonoverlapping regions. The proportion of total genes represented by each area of the diagram is shown in parentheses. The total number of genes in each genome is shown in square brackets.
