
Fig. 6. SSB-GFP reporter tracks Mtb replication in vivo.
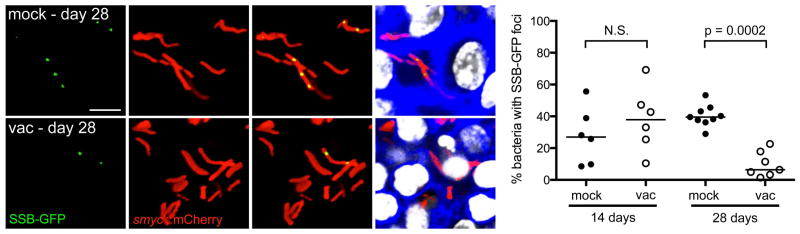
Erdman(SSB-GFP, smyc′::mCherry) was inoculated into vaccinated or mock-treated C57BL/6J WT mice for up to 28 days. 3D confocal images from a 28-day infection are shown with all bacteria marked in red (smyc′::mCherry), reporter signal shown in green (SSB-GFP), nuclei marked in grayscale (DAPI), and phalloidin staining of f-actin shown in blue. For clarity of foci visualization, SSB-GFP signal is shown in extended focus, overlaid on the 3D image. Scale bar 10 μm. Graph shows the percentage of Mtb displaying SSB-GFP foci for each mouse, measured from multiple 3D confocal images, at 14 and 28 days post-challenge. Each point on the graph represents a mouse (mock-treated – filled symbols, vaccinated – open symbols). Horizontal lines mark the median value for each group. p-values were obtained with a Mann-Whitney statistical test. This figure is reproduced from Sukumar et al. (112).