
Figure 3.
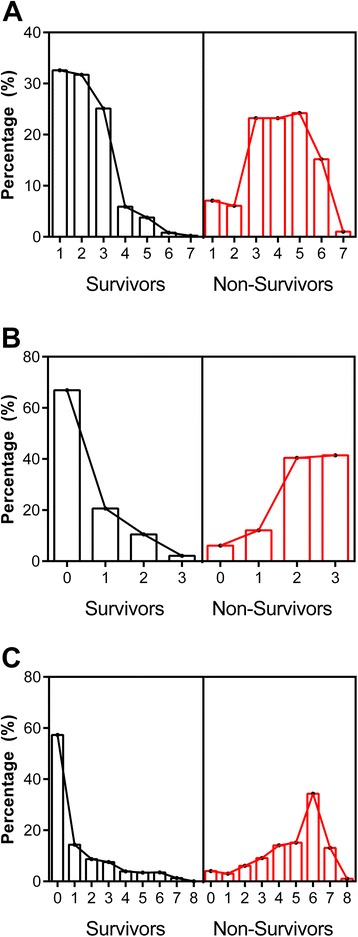
The distribution of disease severity scores for SICK, LODS and PEDIA by mortality. Histograms showing the distribution of disease severity scores for SICK (A ), LODS (B), and PEDIA (C ) as a percentage of survivors (left panel, in black) or non-survivors (right panel, in red). LODS, Lambaréné Organ Dysfunction Score; PEDIA, Pediatric Early Death Index for Africa; SICK, Signs of Inflammation in Children that Kill.