Figure 10.

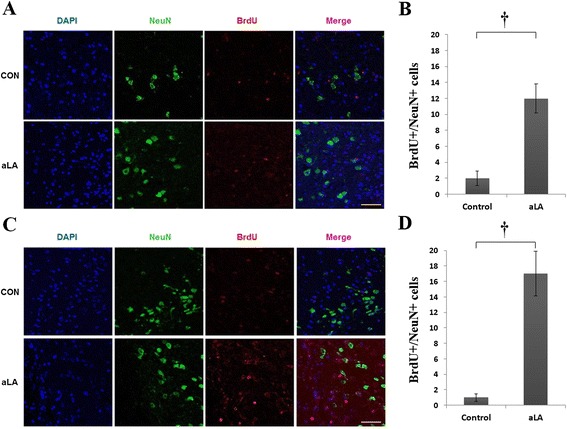
Immunohistochemistry for BrdU (red) and NeuN (green). aLA increased the co-localization of neurons and markers of proliferation in the frontal (A) and temporal (C) boundary zone at 4 weeks after ischemia. Bar graph showing the absolute number of newborn neurons (BrdU/NeuN-positive) in the brain (B and D; *P < 0.05 when compared with the control; Student’s unpaired t test). Data represents mean ± SEM (n = 4 rats/day/group). Scale bars = 50 μm.
