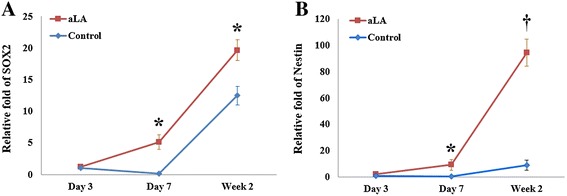
Figure 12.

Changes of relative mRNA expression of SOX2 and Nestin compared to the control group at3 days after cerebral ischemia, as measured by RT-PCR analysis. (A) SOX2 mRNA expression. (B) Nestin mRNA expression. aLA increased the mRNA expression of SOX2 and Nestin at 7 and 14 days after ischemia. Data represents mean ± SEM (n = 3 rats/day in aLA and control groups, n = 1 rat/day in the sham group). *P < 0.05; †P < 0.01 when compared with the control group.
