
Variation in the range of projected weekly values of R0 by country.
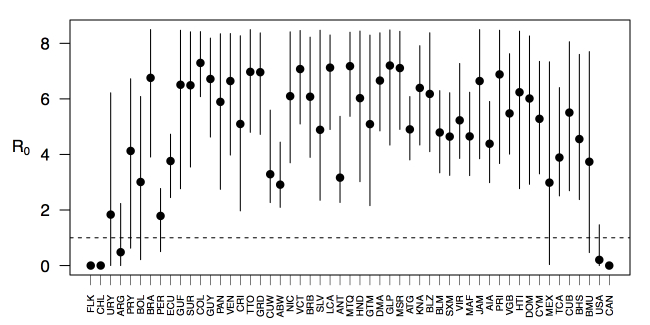
Points show mean values across the year and line segments span the ranges of weekly values. Countries are sorted by the latitudes of their capital cities.
Official websites use .gov
A
.gov website belongs to an official
government organization in the United States.
Secure .gov websites use HTTPS
A lock (
) or https:// means you've safely
connected to the .gov website. Share sensitive
information only on official, secure websites.
Points show mean values across the year and line segments span the ranges of weekly values. Countries are sorted by the latitudes of their capital cities.