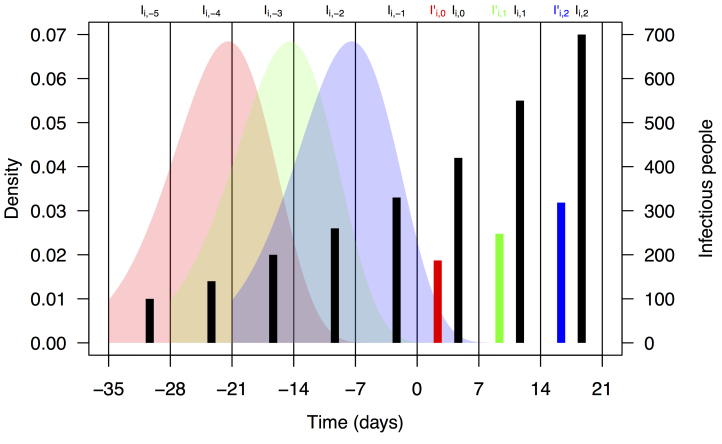
Schematic representation of the calculation of effective numbers of infectious people, I'i,t.
Black bars represent observed weekly case numbers, and red, green, and blue bars in weeks 0-2 represent effective numbers of infectious people in three consecutive weeks. Colored shapes show the serial interval distributions used in the calculation of ωn and then in the calculation of I' i,t in each of weeks 0-2. Weekly case numbers were chosen for pedagogical purposes and do not reflect empirical data.

