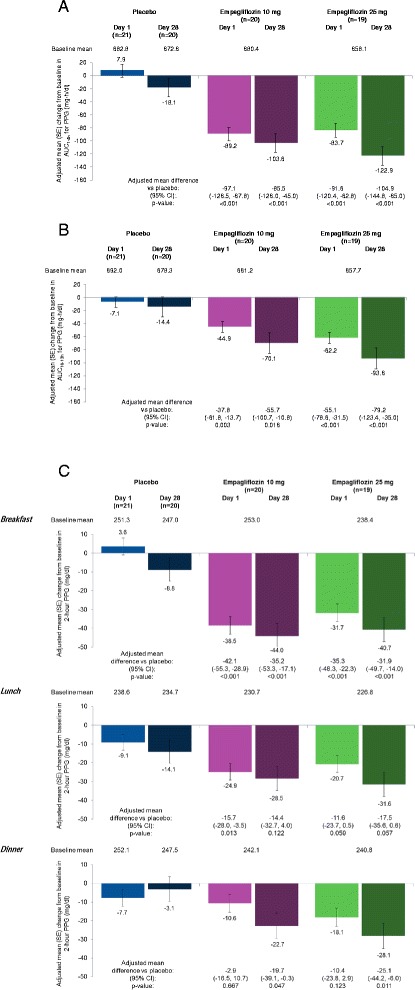
Figure 2.

Changes from baseline in (A) AUC 1-4 h for PPG, (B) AUC 10-13 h for PPG and (C) 2-hour PPG after each meal, based on analyses of covariance in the full analysis set. CI, confidence interval; PPG, postprandial glucose; SE, standard error.

Changes from baseline in (A) AUC 1-4 h for PPG, (B) AUC 10-13 h for PPG and (C) 2-hour PPG after each meal, based on analyses of covariance in the full analysis set. CI, confidence interval; PPG, postprandial glucose; SE, standard error.