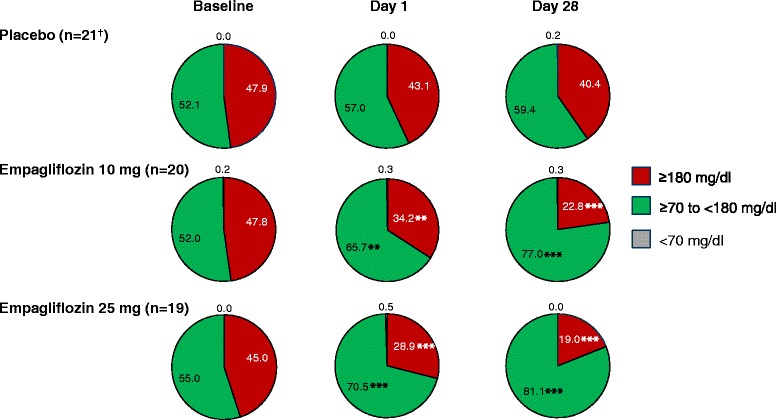
Figure 6.

Percentage of time with glucose level ≥180 mg/dl, ≥70 to <180 mg/dl, and <70 mg/dl, based on analyses of covariance in the full analysis set. Baseline data are means, day 1 and day 28 data are adjusted means. **p<0.01; ***p<0.001 for difference vs placebo in change from baseline; †n=20 at day 28.
