
Fig. 1. Characteristics of the five CD1 isoforms and distribution among animal models.
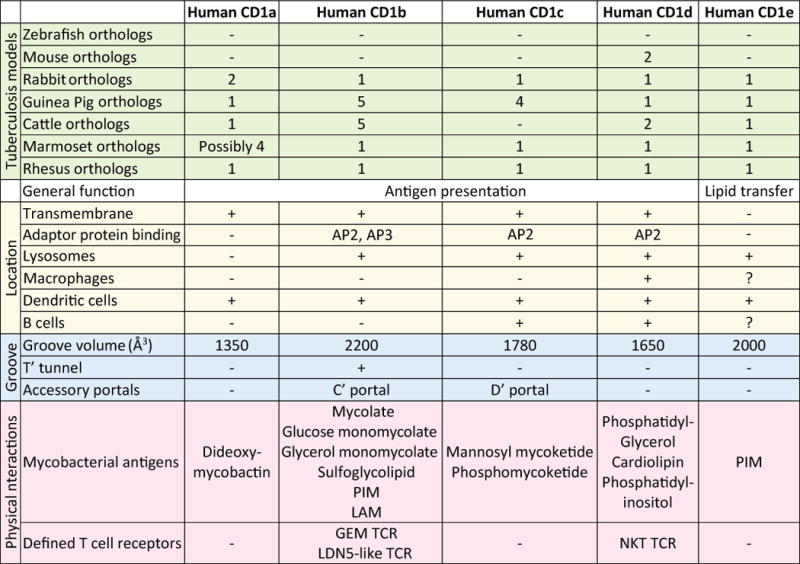
The numbers of orthologous CD1 genes are given for animals that are commonly used as model for tuberculosis (green). The expression and functions of these genes have only been studied in humans, cows, guinea pigs, and non-human primates. Gene numbers are based on published papers and, when no information is available, on annotated genes in the genomes (available at www.ensembl.org). Subcellular location and cellular expression profile (yellow), groove characteristics (blue), and interacting antigens and T-cell receptors (pink) are shown for each human CD1 isoform.