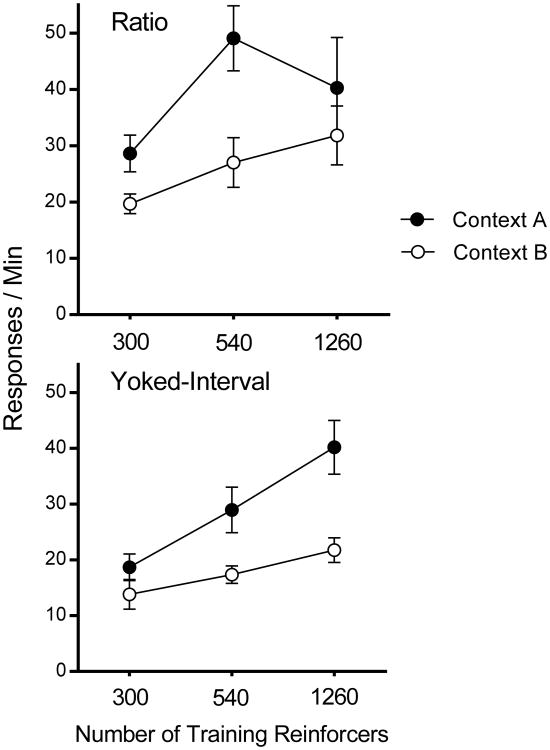
Figure 2.
Results of Experiment 1. Mean response rates during the extinction test in Contexts A and B plotted as a function of total number of reinforced responses in training. Error bars represent SEM. Error bars are included for comparison of between-group differences, and are not relevant for interpreting within-subject differences (i.e., the context effect).

