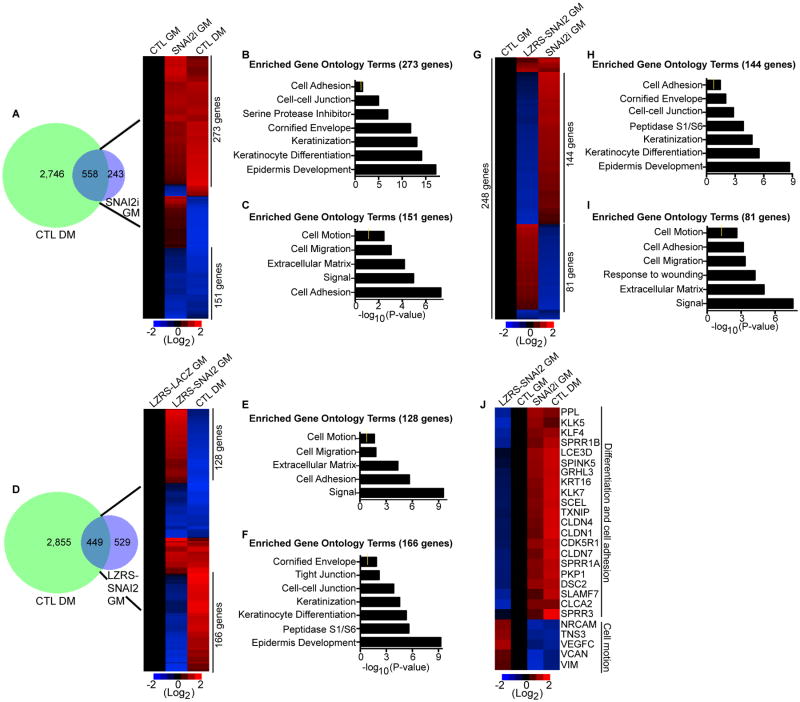
Figure 3. SNAI2 represses the differentiation gene expression program.
(A) Overlap (left panel) of the differentiation gene signature (CTL DM: 3,304 genes change) with the genes that change upon knockdown of SNAI2 in cells cultured in growth medium (SNAI2i GM: 801 genes change). The differentiation gene signature (DM) is the differentially expressed genes between cells grown in low calcium (growth medium:GM) to cells grown in high calcium (differentiation medium:DM). Heat map (right panel) of the 558 genes that overlap. Differentiated control samples (CTL DM) were compared to control (CTL GM) and SNAI2i (SNAI2i GM) samples. Heat map is shown in red (induced genes) and blue (repressed genes) on a log2-based scale. (B) Gene ontology analysis of genes with increased expression that are co-regulated by SNAI2i GM and CTL DM samples. Yellow mark in bar graphs demark p value=0.5. (C) Gene ontology analysis of co-regulated genes with decreased expression. (D) Overlap (left panel) of CTL DM with the genes that change upon overexpression of SNAI2. LZRS-SNAI2 cells were cultured in growth medium (LZRS-SNAI2 GM). Heat map (right panel) of the 449 genes that overlap. Differentiated samples (CTL DM) were compared to control LZRS-LACZ GM and LZRS-SNAI2 GM samples. (E-F) Gene ontology analysis of genes oppositely regulated between LZRS-SNAI2 GM and CTL DM samples. (G) Heat map of the 248 genes that overlap between LZRS-SNAI2 GM and SNAI2i GM samples. (H-I) Gene ontology analysis of genes oppositely regulated between LZRS-SNAI2 GM and SNAI2i GM samples. (J) Heat map of differentiation, cell adhesion, and cell motility genes.

