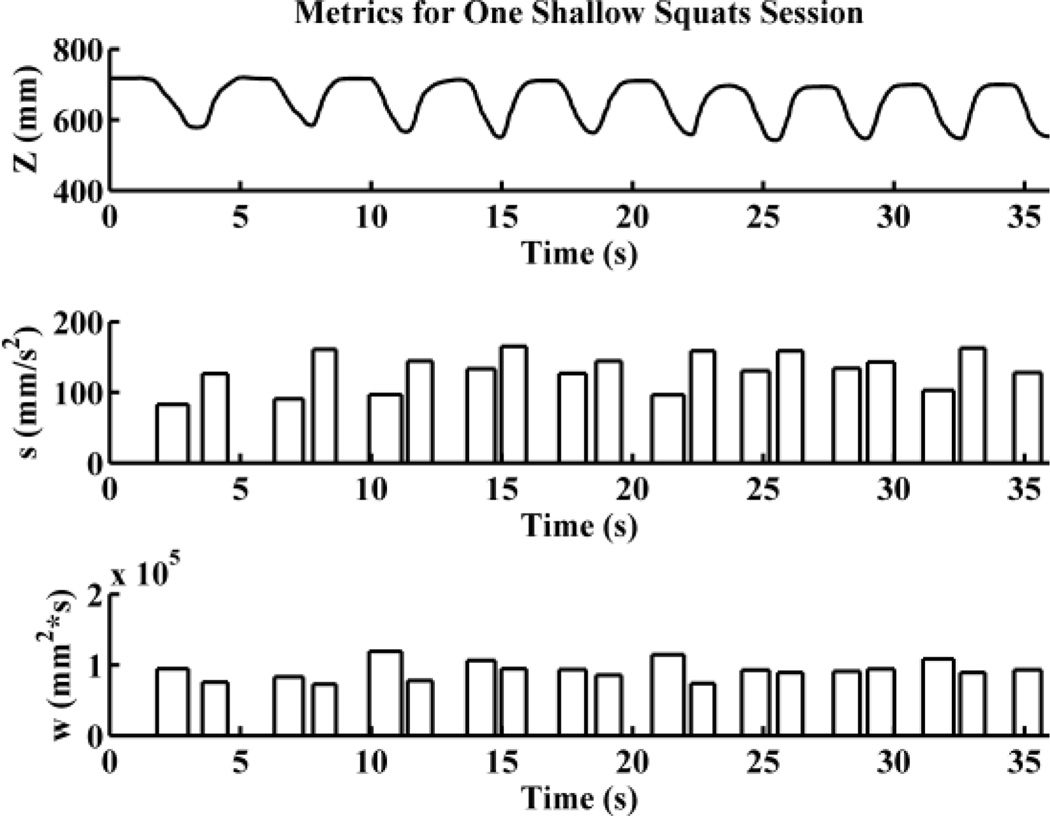
Figure 2.
Metrics for one shallow squats exercise session. The first plot show the position Z of the hip above the floor throughout the session. The second and third plots show the s (strength) and w (work) metric values for identified upward and downward movements during the session. The peaks of the bars indicate the metric values and the widths of the bars indicate the time interval over which the movements were estimated to occur. Note regular variation between upward and downward movements likely related to moving relative to gravity.

