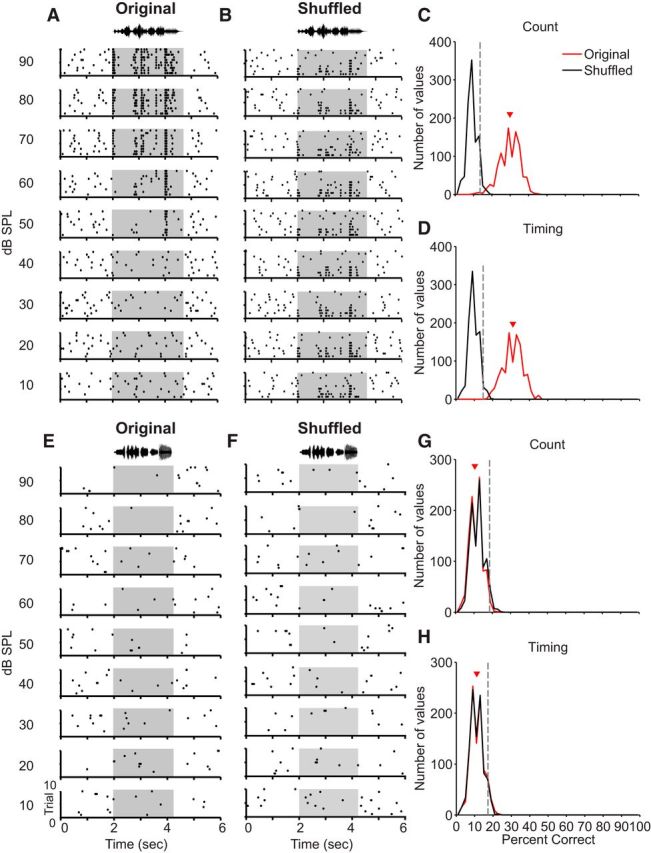
Figure 2.

Demonstration of trial shuffling approach. Trial shuffling removes intensity-specific information, generating a distribution of random percentage correct values. To assess statistical significance, the distribution of the original (unshuffled) dataset is compared with 95th percentile of the shuffled (random) distribution (for full details, see Materials and Methods). A, Representative raster plots from a single “bicoding” neuron recorded from a nonbreeding male (see Results and Fig. 3). Same plot conventions as in Figure 1A. B, Raster plots for the same unit as in A, after shuffling trials to remove intensity-specific information. C, Distributions of count-based percentage correct values for the original (red) and trial-shuffled (black) data. Each distribution incorporates 1000 percent correct estimates (1 for each repetition of the pattern classifier). Red triangle represents mean for the original distribution; gray dashed line indicates the 95th percentile of the shuffled distribution. D, Distributions of timing-based percentage correct values. Plot conventions are identical to C. E–H, Raster plots (E, F) and percentage correct distributions (G, H) for a single unit recorded from a nonbreeding female classified as incapable of intensity discrimination.
