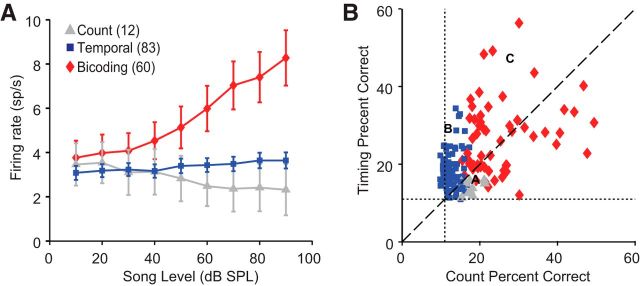
Figure 4.
A, Data are mean ± SEM song-evoked firing rate-level profiles for each cell group. Firing rates for each cell were averaged across the entire song duration. Count cells (gray triangles) display monotonically decreasing firing rates as song level increases. Temporal cells (blue squares) display flat rate-level functions. Bicoding cells (red diamonds) show monotonically increasing firing rates as song amplitude increases. B, Scatter plot illustrating the spike timing-based (y-axis) and spike count-based (x-axis) percentage correct values for each cell in the dataset. Symbols and colors (same as A) indicate cell type. Letters indicate the representative cells shown in Figure 3. Dotted lines indicate chance performance.

