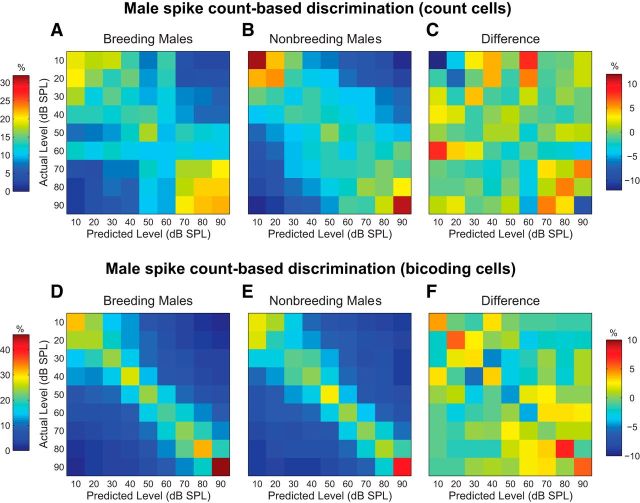
Figure 5.
Breeding condition does not affect male spike count-based intensity discrimination. A, Spike count-based confusion matrix for count cells from breeding males. Rows represent actual song intensity levels; columns represent song intensity levels predicted by the spike count-based classifier. Correct estimates fall along the diagonal running from the upper left to the bottom right corner. The percentage of spike train assignments are represented by color, as indicated by the bar on the left. Plot conventions are identical for B, D, and E. B, Confusion matrix for count cells from nonbreeding males. C, Confusion matrix created by subtracting the nonbreeding male matrix in B from the breeding male matrix in A. A different color scale is used, as indicated by the bar on the right. D, Spike count-based confusion matrix for bicoding cells from breeding males. E, Confusion matrix for bicoding cells from nonbreeding males. F, Confusion matrix created by subtracting the nonbreeding male matrix in E from the breeding male matrix in D.

