Figure 9.

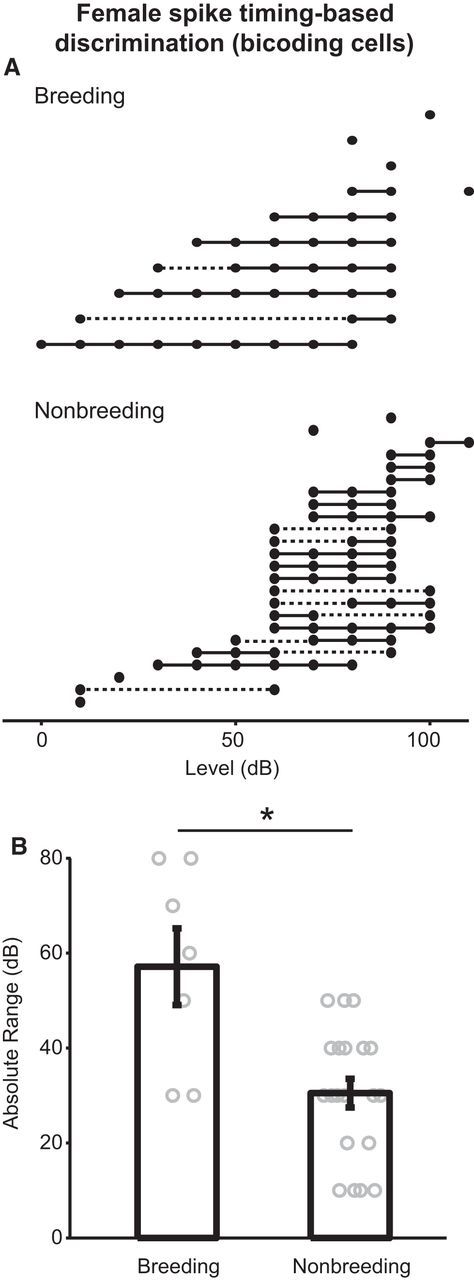
Breeding condition increases the range of song intensities discriminable by female bicoding cells. A, Plot illustrating the range of discriminable intensities for female bicoding cells. Each row represents one neuron. Intensities that are discriminable at a statistically significant level are represented by filled dots (for isolated intensities) and thick solid lines (for a series of consecutive intensities). Gaps in the range (where intensities are not significantly discriminable) are connected by dashed lines to aid the viewer. Cells are grouped by breeding (top) or nonbreeding (bottom) condition and are arranged in order of the lowest intensity significantly discriminable. B, Plot examining the effect of breeding condition on absolute discrimination range of female bicoding cells. Error bars indicate mean ± SEM. Circles represent individual neurons. *p < 0.05.
