
Figure 3.
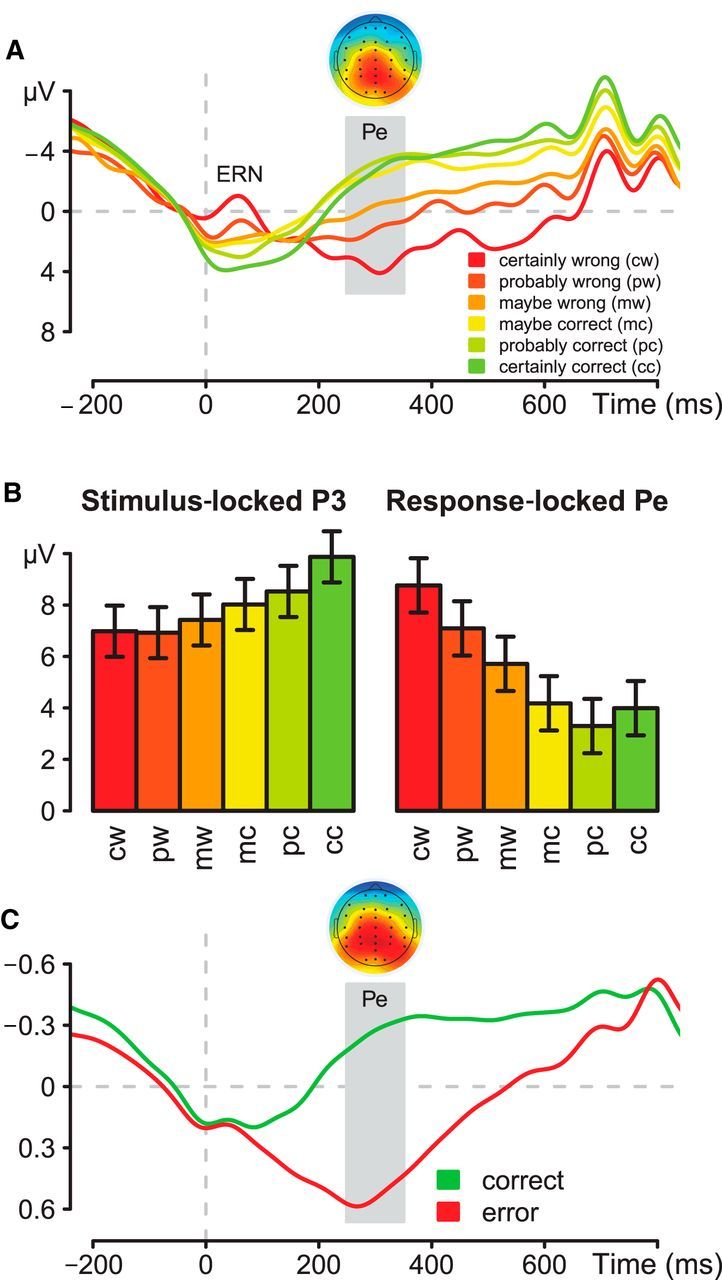
A, Pe at electrode Pz, conditioned on level of confidence for errors and correct trials; response-locked ERP and topography for the difference between “certainly wrong” and “certainly correct” conditions from 250 to 350 ms; the topographic plot indicates voltages as colors from blue (−8 μV) to red (+8 μV). B, Stimulus-locked P3 and response-locked Pe at electrode Pz, conditioned on level of confidence for errors and correct trials with a prestimulus baseline for both potentials. C, Time course and spatial projection of the discriminating component identified by the classification analysis of errors versus correct responses, coded in arbitrary units.