Figure 3.
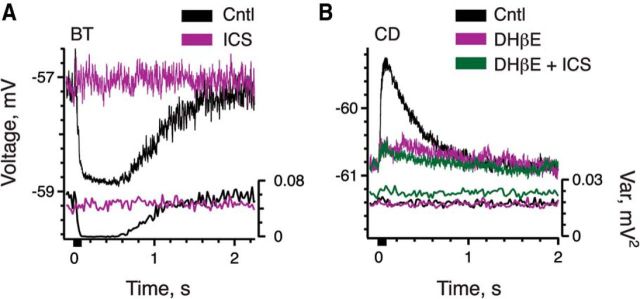
Mechanisms of efferent-mediated inhibition are distinct from efferent-mediated excitation. A, B, Intracellular recordings were obtained from a BT (A) and CD (B) afferent during electrical activation of efferent fibers. Efferent shock trains (20 shocks at 200/s, black bar at t = 0) were delivered every 3–5 s. Ensemble means (top, left axis in millivolts) and variances (bottom, right axis in square millivolts) for each unit were based on ≥20 shock train presentations. A, Ensemble mean and variance in a BT afferent to the standard efferent shock train before (black traces) and during (magenta traces) application of 10 μm ICS. B, Ensemble mean and variance in a CD afferent in response to the standard efferent shock train during the sequential application of control solution alone (Cntl, black), 300 nm DHβE (magenta), and 300 nm DHBE with 10 μm ICS (green).

