Figure 2.

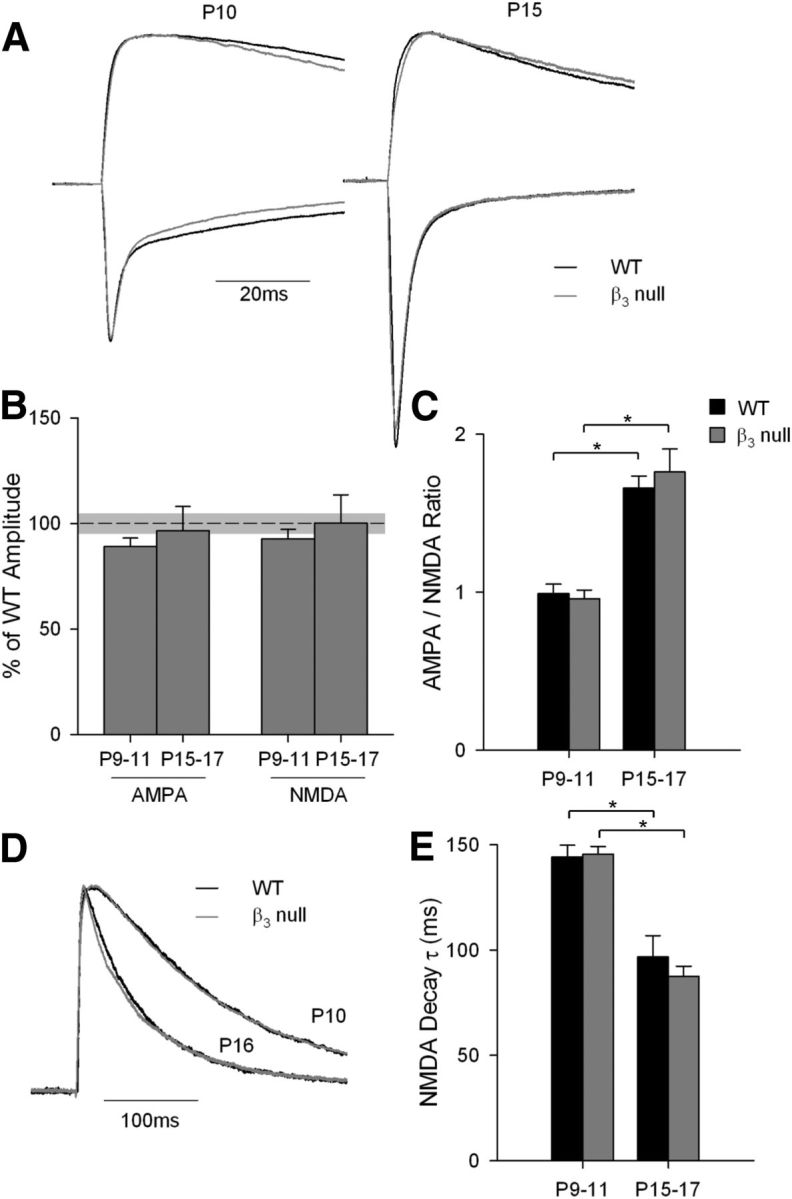
AMPA and NMDA currents in WT and β3-null dLGN cells. A, Representative maximal current traces at −70 mV (showing the fast inward AMPAR current) and +40 mV (showing the slowly decaying outward NMDAR current) at P10 and P15 in WT cells (black) and β3-null cells (gray). Traces are normalized to the peak NMDAR current. B, Plot showing the mean and SEM maximal amplitude of AMPAR and NMDAR currents at P9–P11 and P15–P17 in β3-null cells. Values are expressed relative to WT currents [mean (black dashed line) and SEM (light gray shading)]. Within each age group, the maximal currents for AMPARs and NMDARs were not different from those of WT cells. C, Plot of mean and SEM AMPAR/NMDAR current ratio at P9–P11 and P15–P17 for WT and β3-null mice. For both groups, AMPAR currents strengthened with age. D, Representative NMDAR current traces at P10 and P16 for WT and β3-null mice. Traces were normalized to the peak NMDAR current. E, Plot of mean and SEM NMDAR decay τ values (determined with a single exponential fit). For both groups, decay times were slower at P9–P11. *p < 0.001, both age groups vs condition. Responses in A and D were recorded in the presence of bicuculline, CGP, and nimodipine. β3-null cells (WT cells): P9–P11 amplitude and ratio, 26 (21); τ, 37 (29); P15–P17 amplitude and ratio, 22 (19); τ, 35 (29).
