Figure 3.

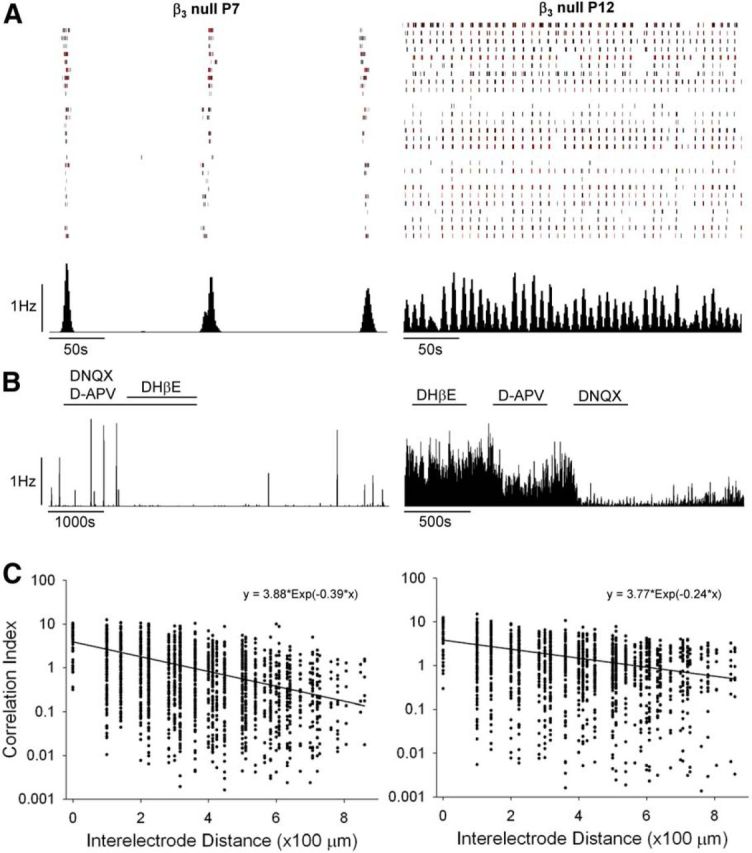
Retinal waves in β3-null mice. A, Rasters depicting spike trains for 30 simultaneously recorded RGCs from β3-null retinae at P7 and P12 for a period of 300 s. Black vertical lines depict a single spike, and red lines depict 10 spikes. Below each raster is the corresponding histogram (1 s bins) showing the firing rate of the cells recorded above. B, Representative response histograms demonstrating the underlying pharmacology of retinal waves. At P7, waves persisted in the presence of the glutamatergic antagonists DNQX and d-APV, but were blocked by the cholinergic antagonist DHβE. At P12, waves continued in the presence of DHβE, but were blocked by d-APV and DNQX. C, Plots showing correlation indices between pairs of cells (2300 pairs from three mice at P7; 1600 pairs from three mice at P12), with each dot representing one pair, as a function of the estimated distance separating the pair. For each age, the least-squares fit (solid line) and corresponding equation to an exponential decaying function are shown.
